Here graphs based on the MSU UAH dataset (satellite) created by John Christy/Roy Spencer.
Regular updates. Check date in graph.
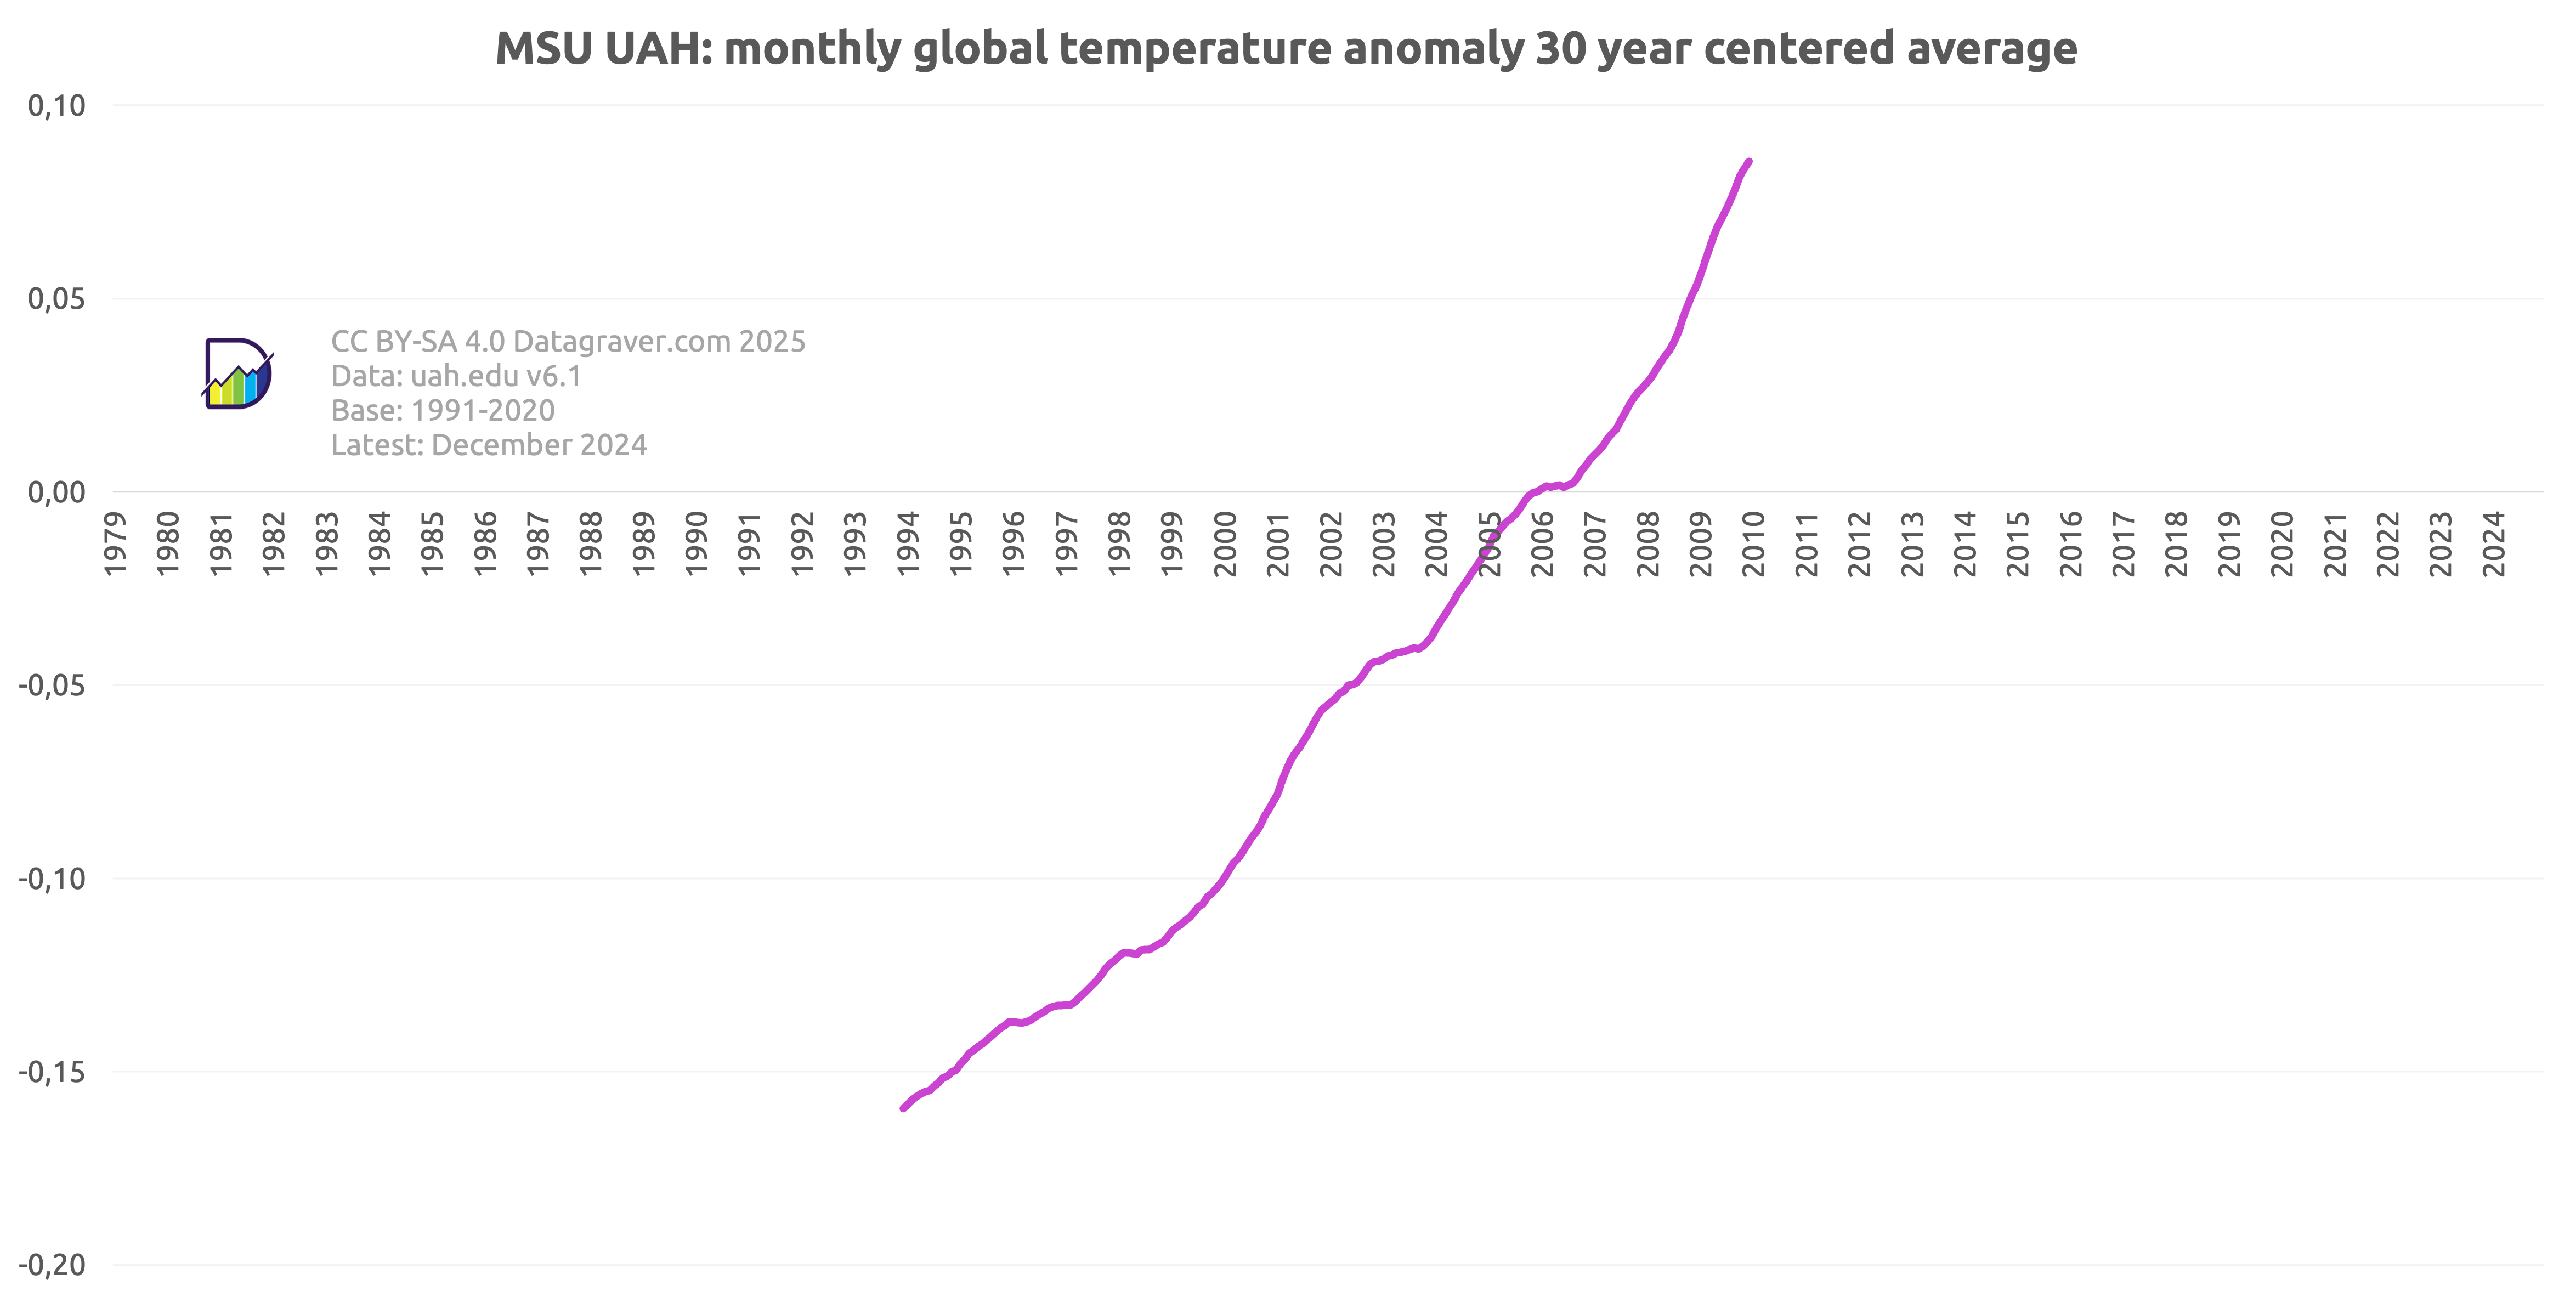
First graph is on the monthly anomalies plus a moving 10 year average.

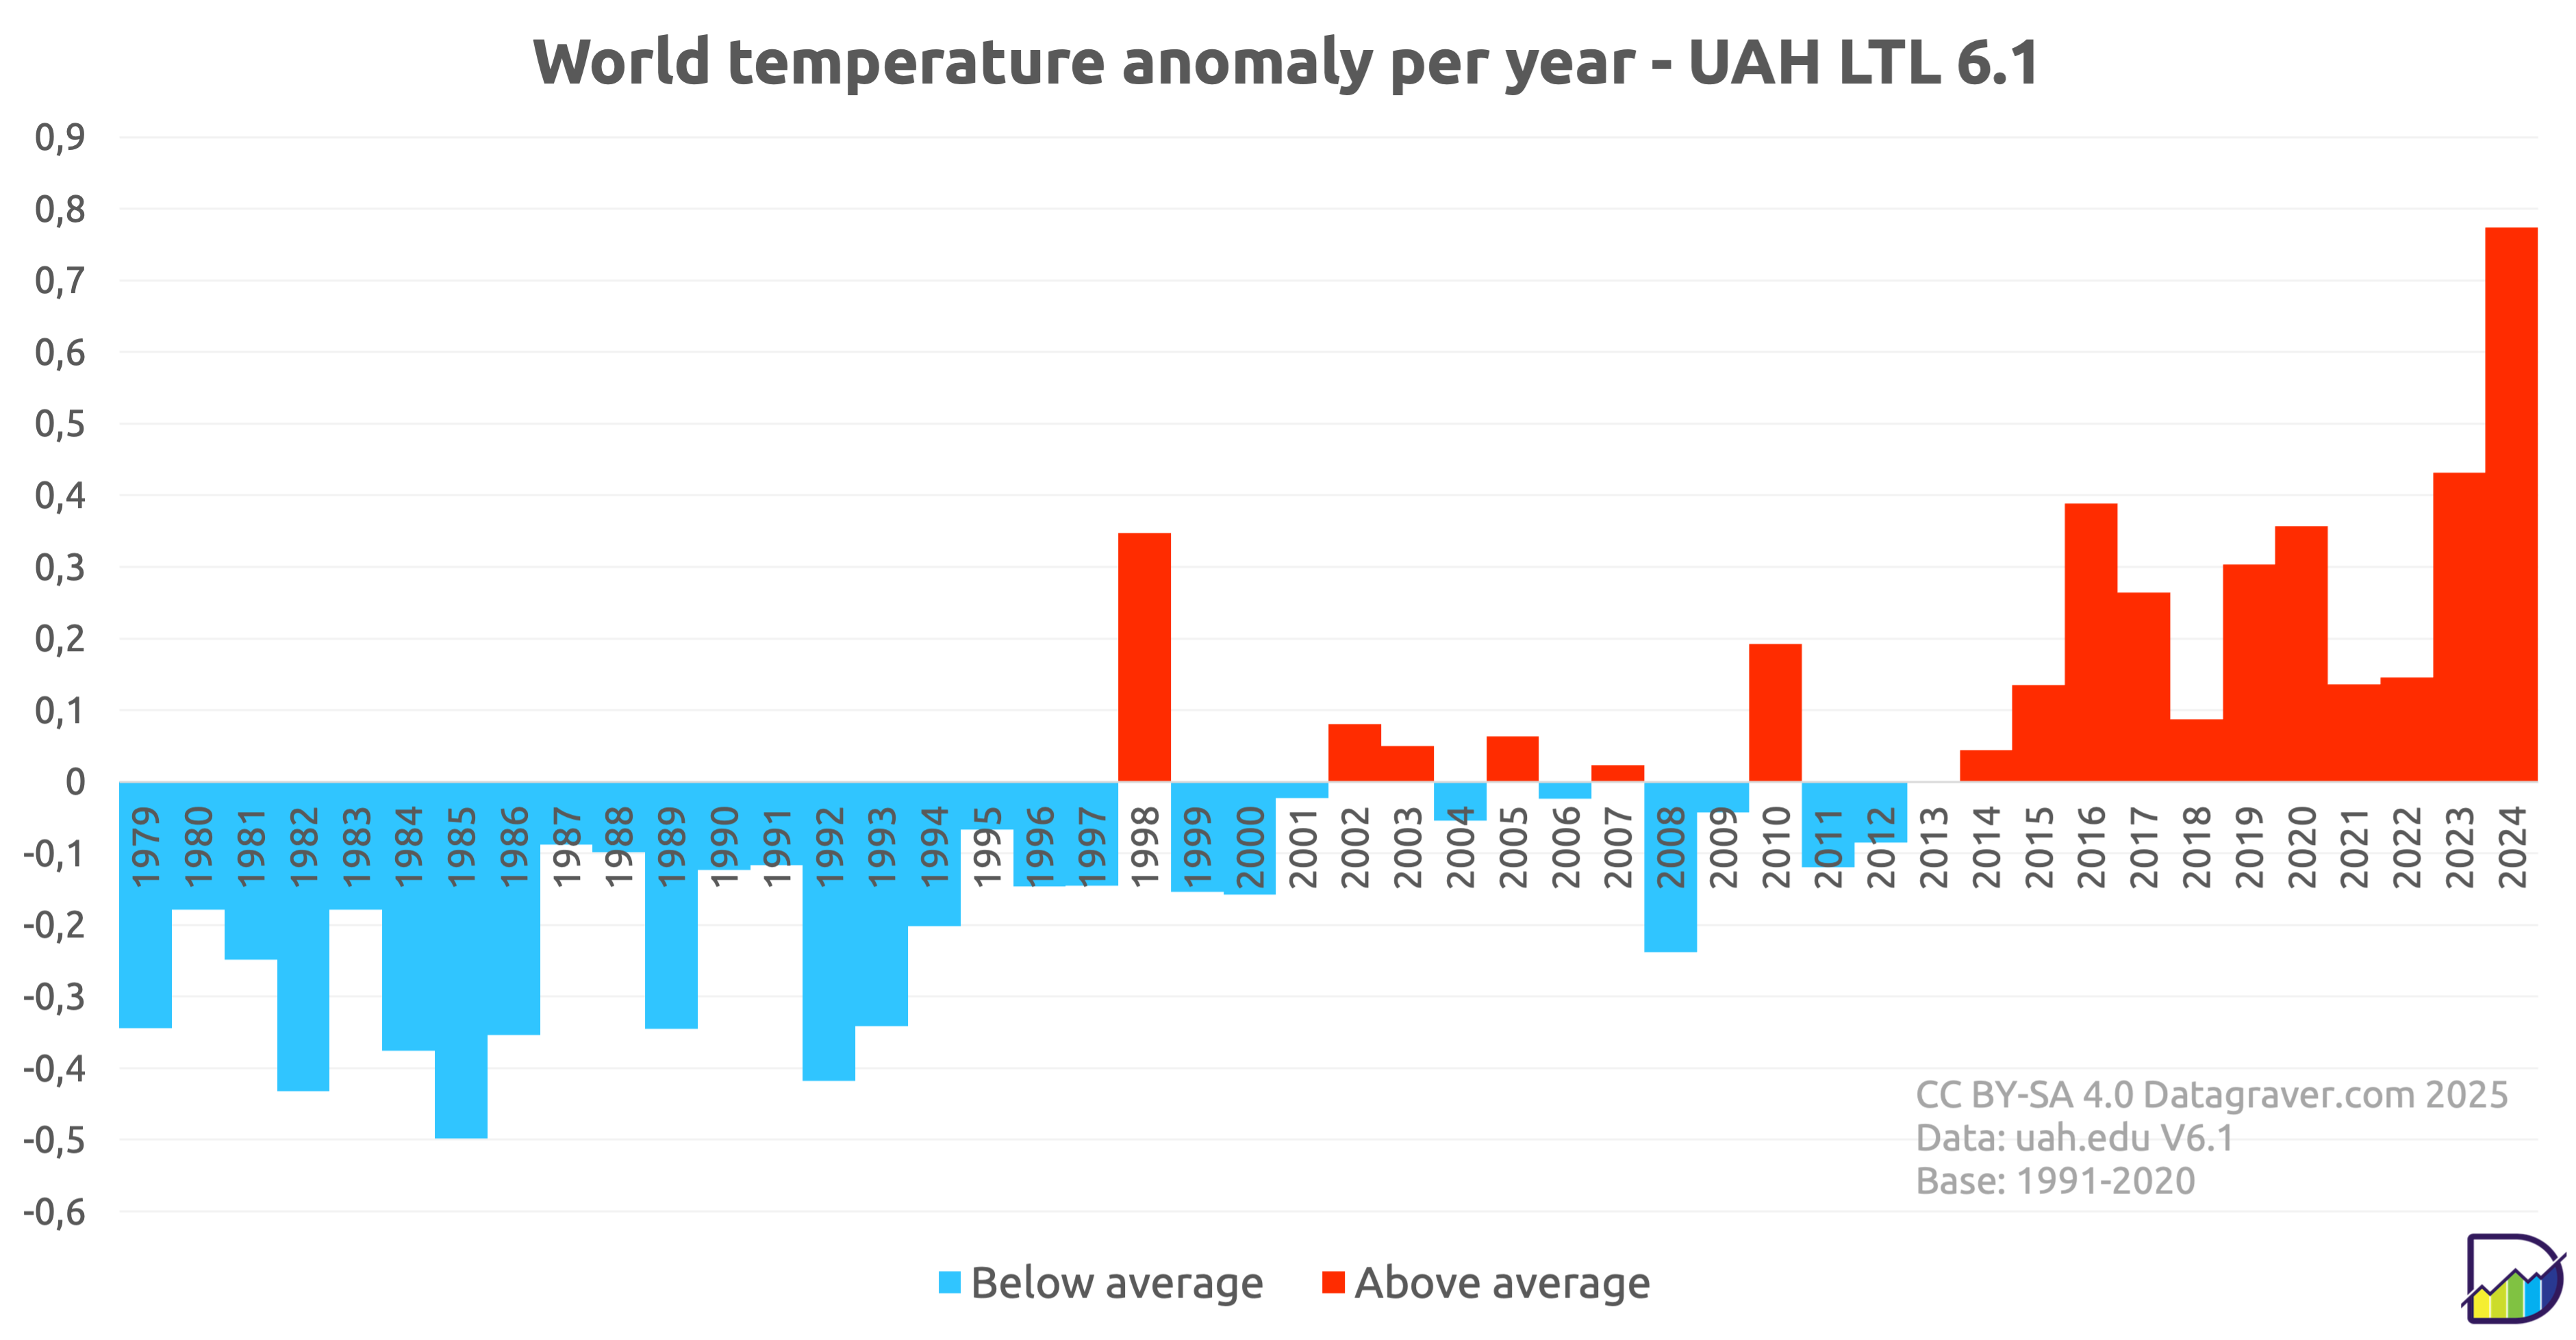
Yearly anomalies.
Digging data
Here graphs based on the MSU UAH dataset (satellite) created by John Christy/Roy Spencer.
Regular updates. Check date in graph.
First graph is on the monthly anomalies plus a moving 10 year average.
Yearly anomalies.