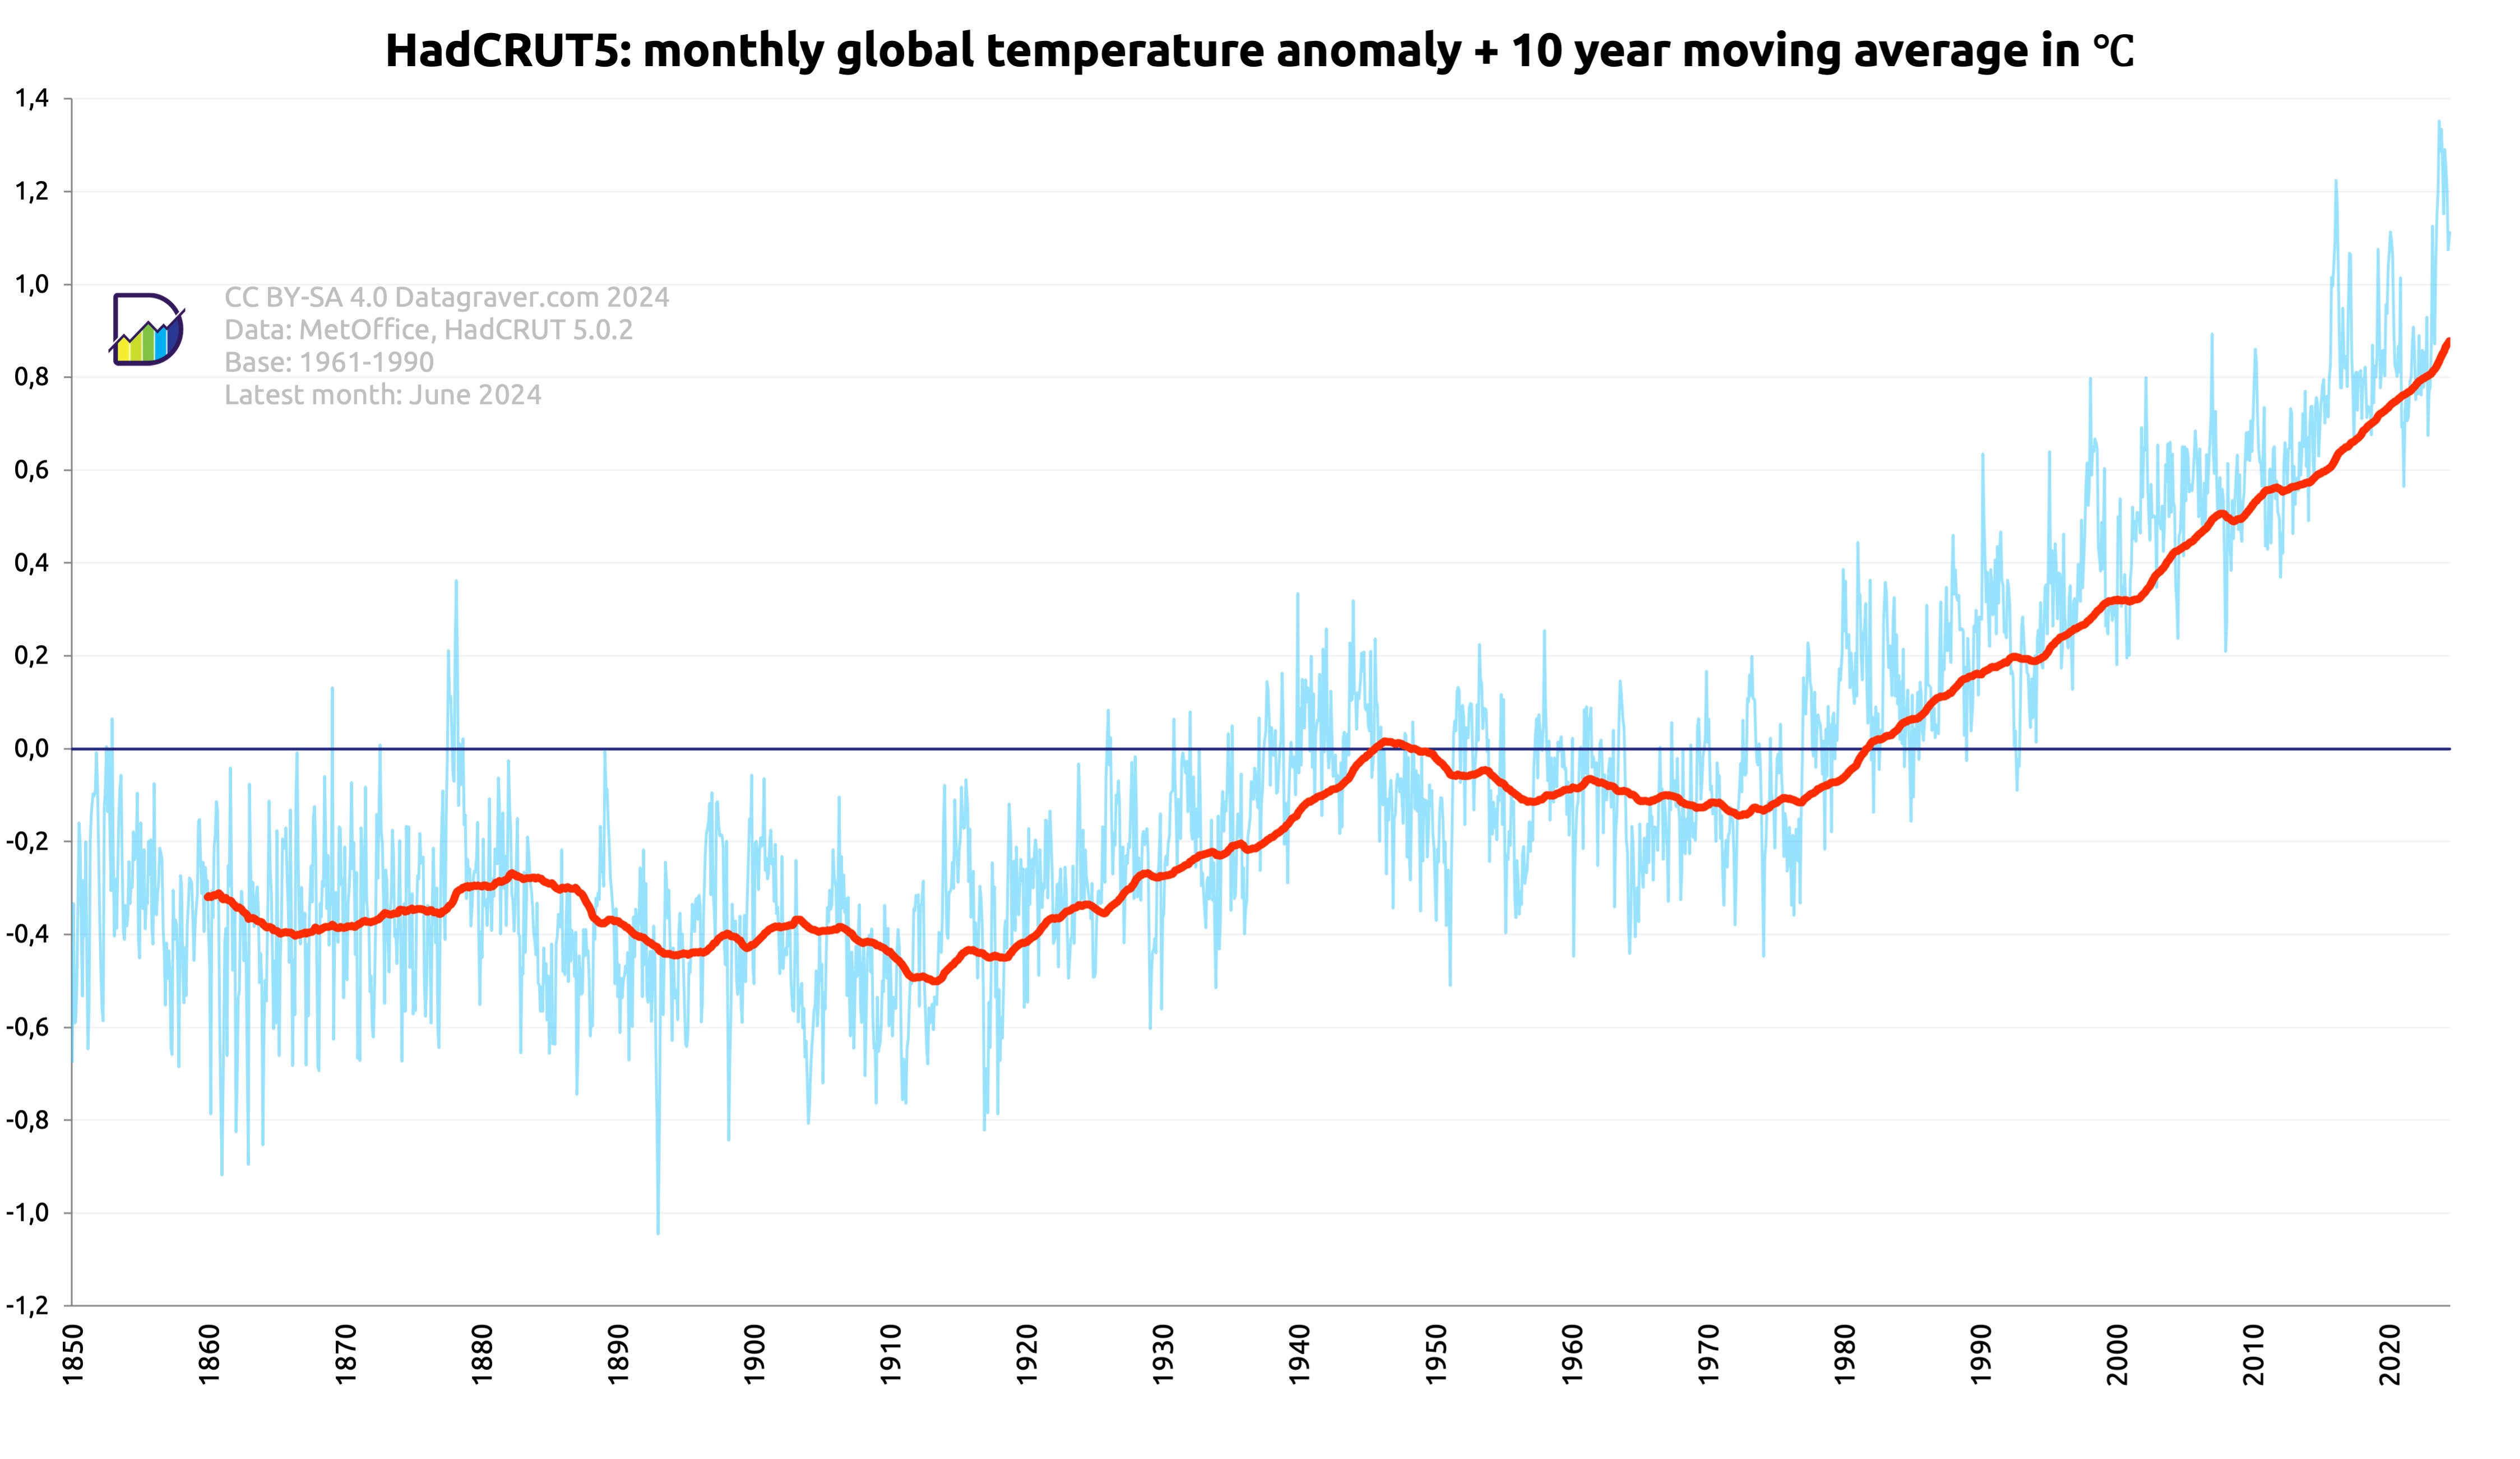
Here graphs based on the HadCRUT 5.0.2 dataset created by the Met Office (UK).
Regular updates. Check date in graph.
First graph is on the monthly anomalies plus a moving 10 year average.
Digging data
Here graphs based on the HadCRUT 5.0.2 dataset created by the Met Office (UK).
Regular updates. Check date in graph.
First graph is on the monthly anomalies plus a moving 10 year average.
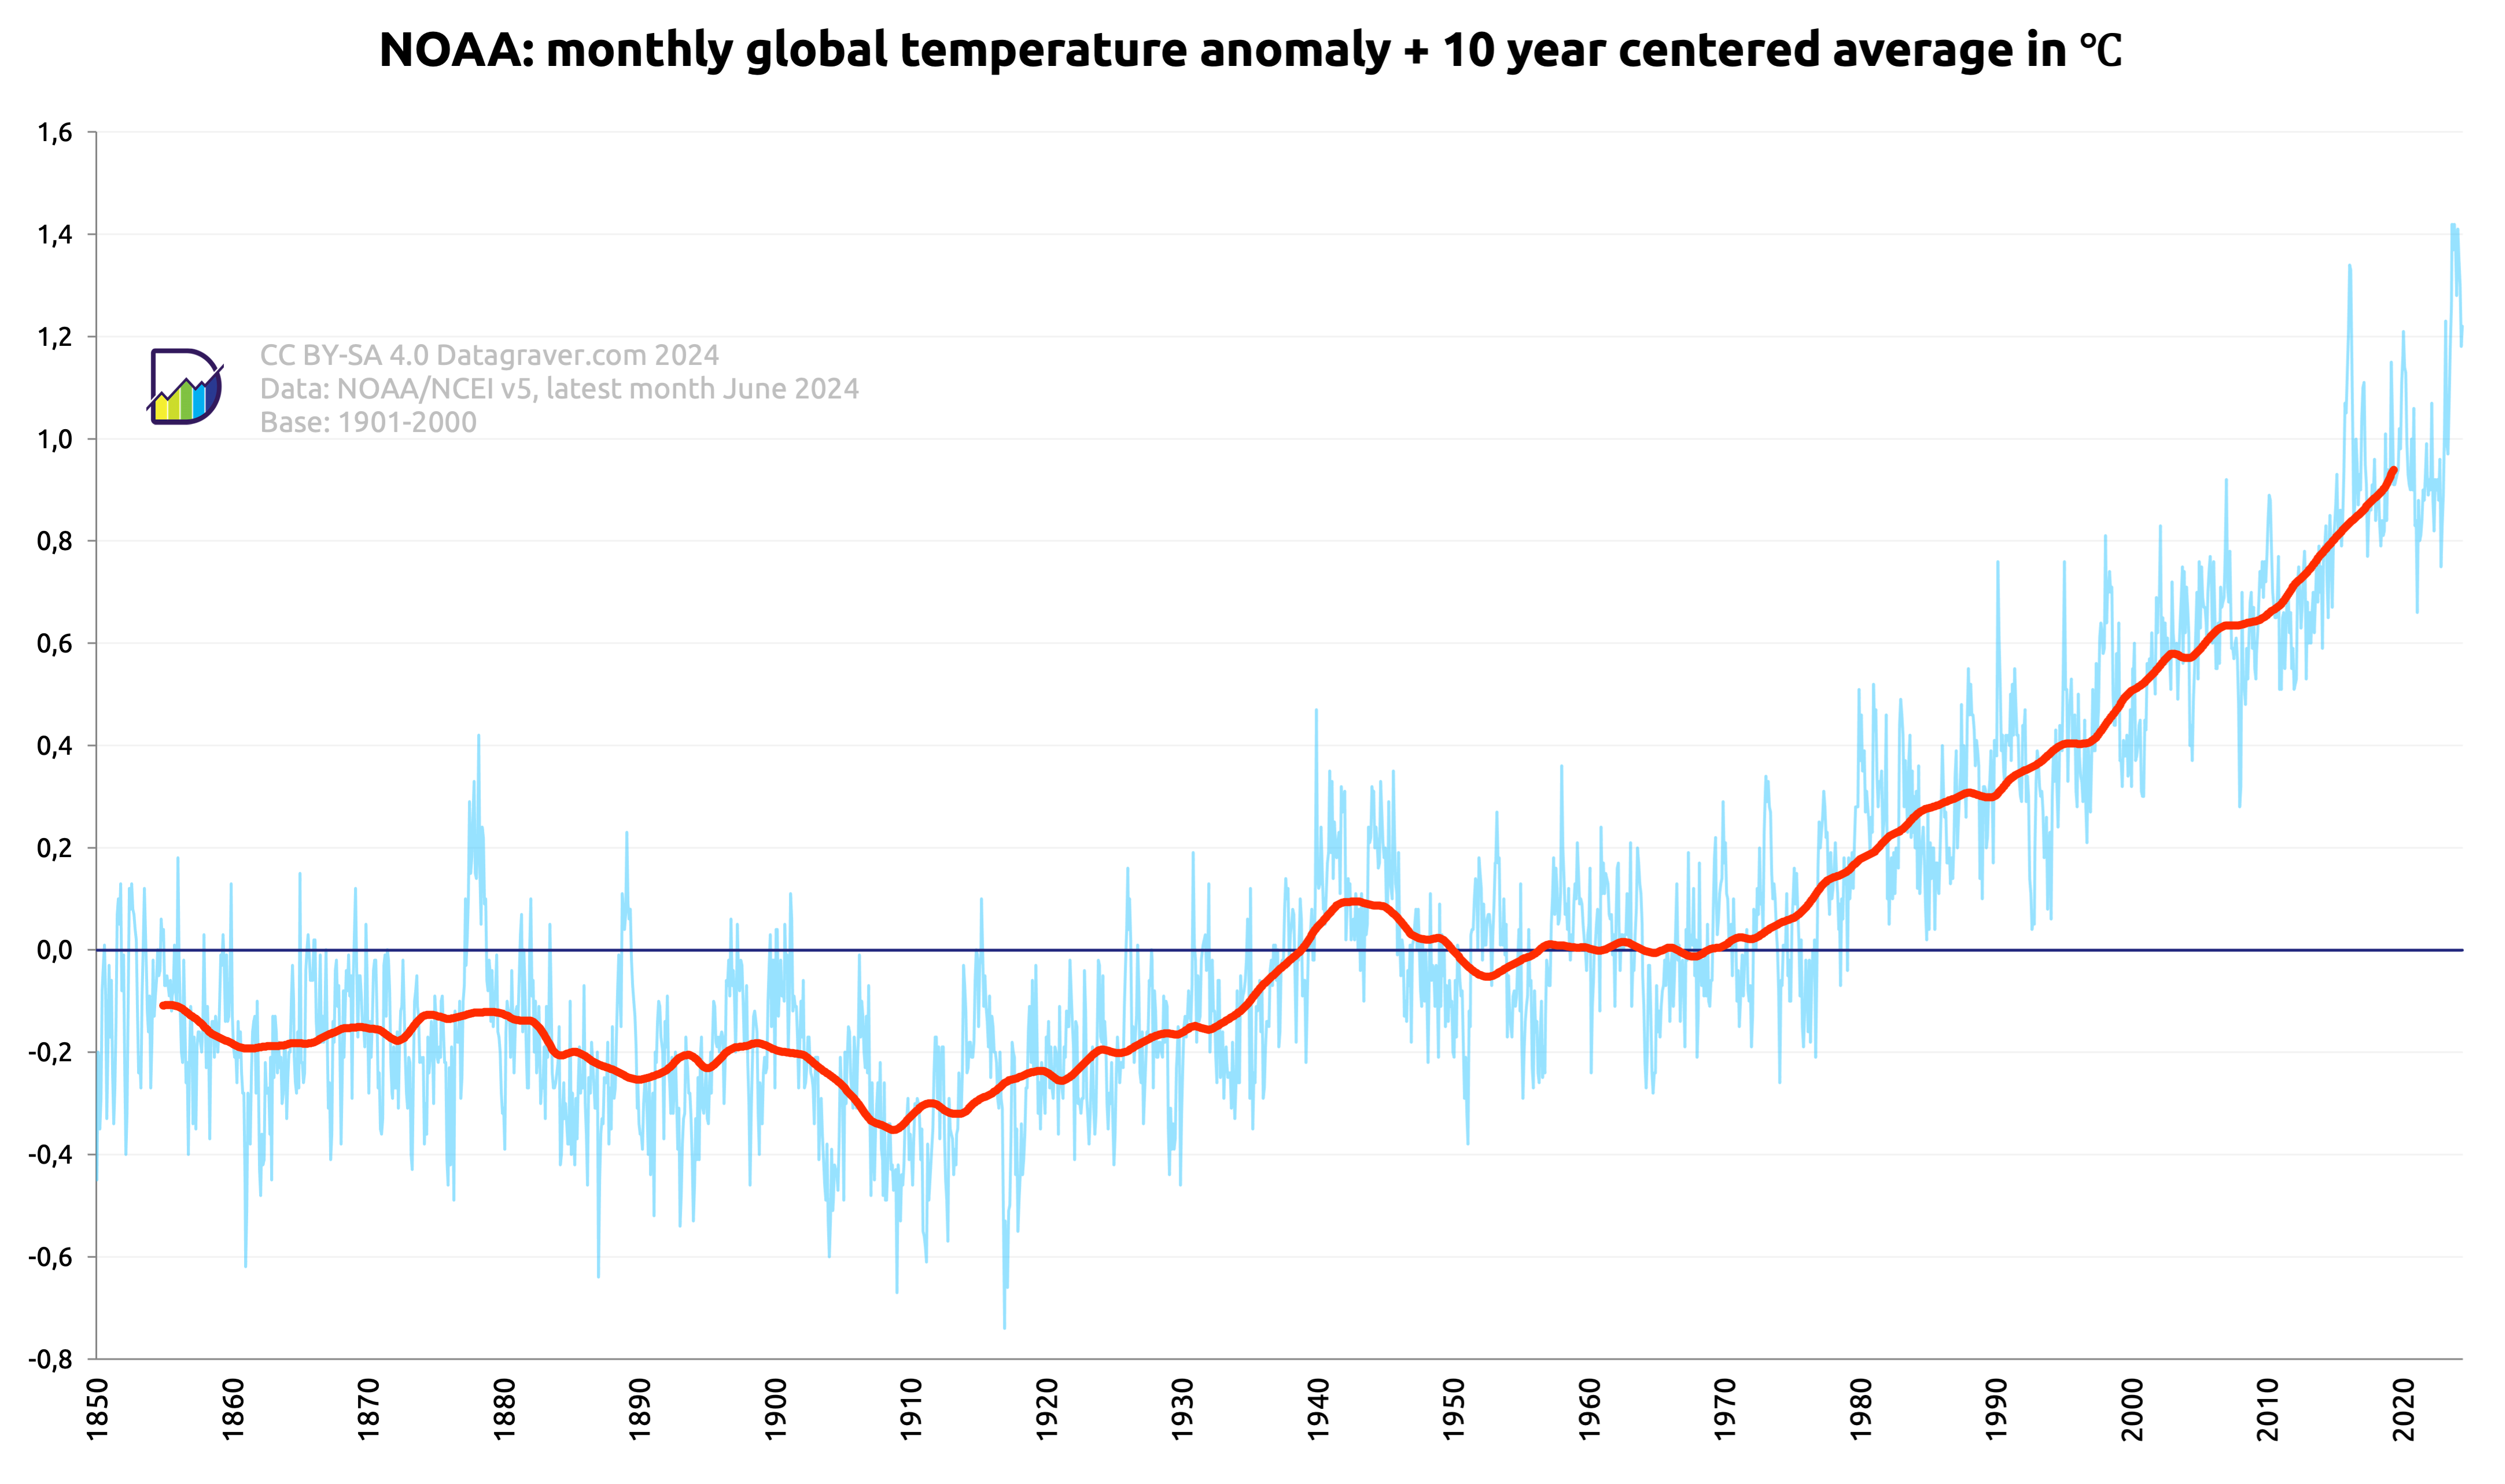
Here graphs based on the V5.1 dataset created by NOAA/NCEI.
Regular updates. Check date in graph.
First graph is on the monthly anomalies plus a centered 10 year average.
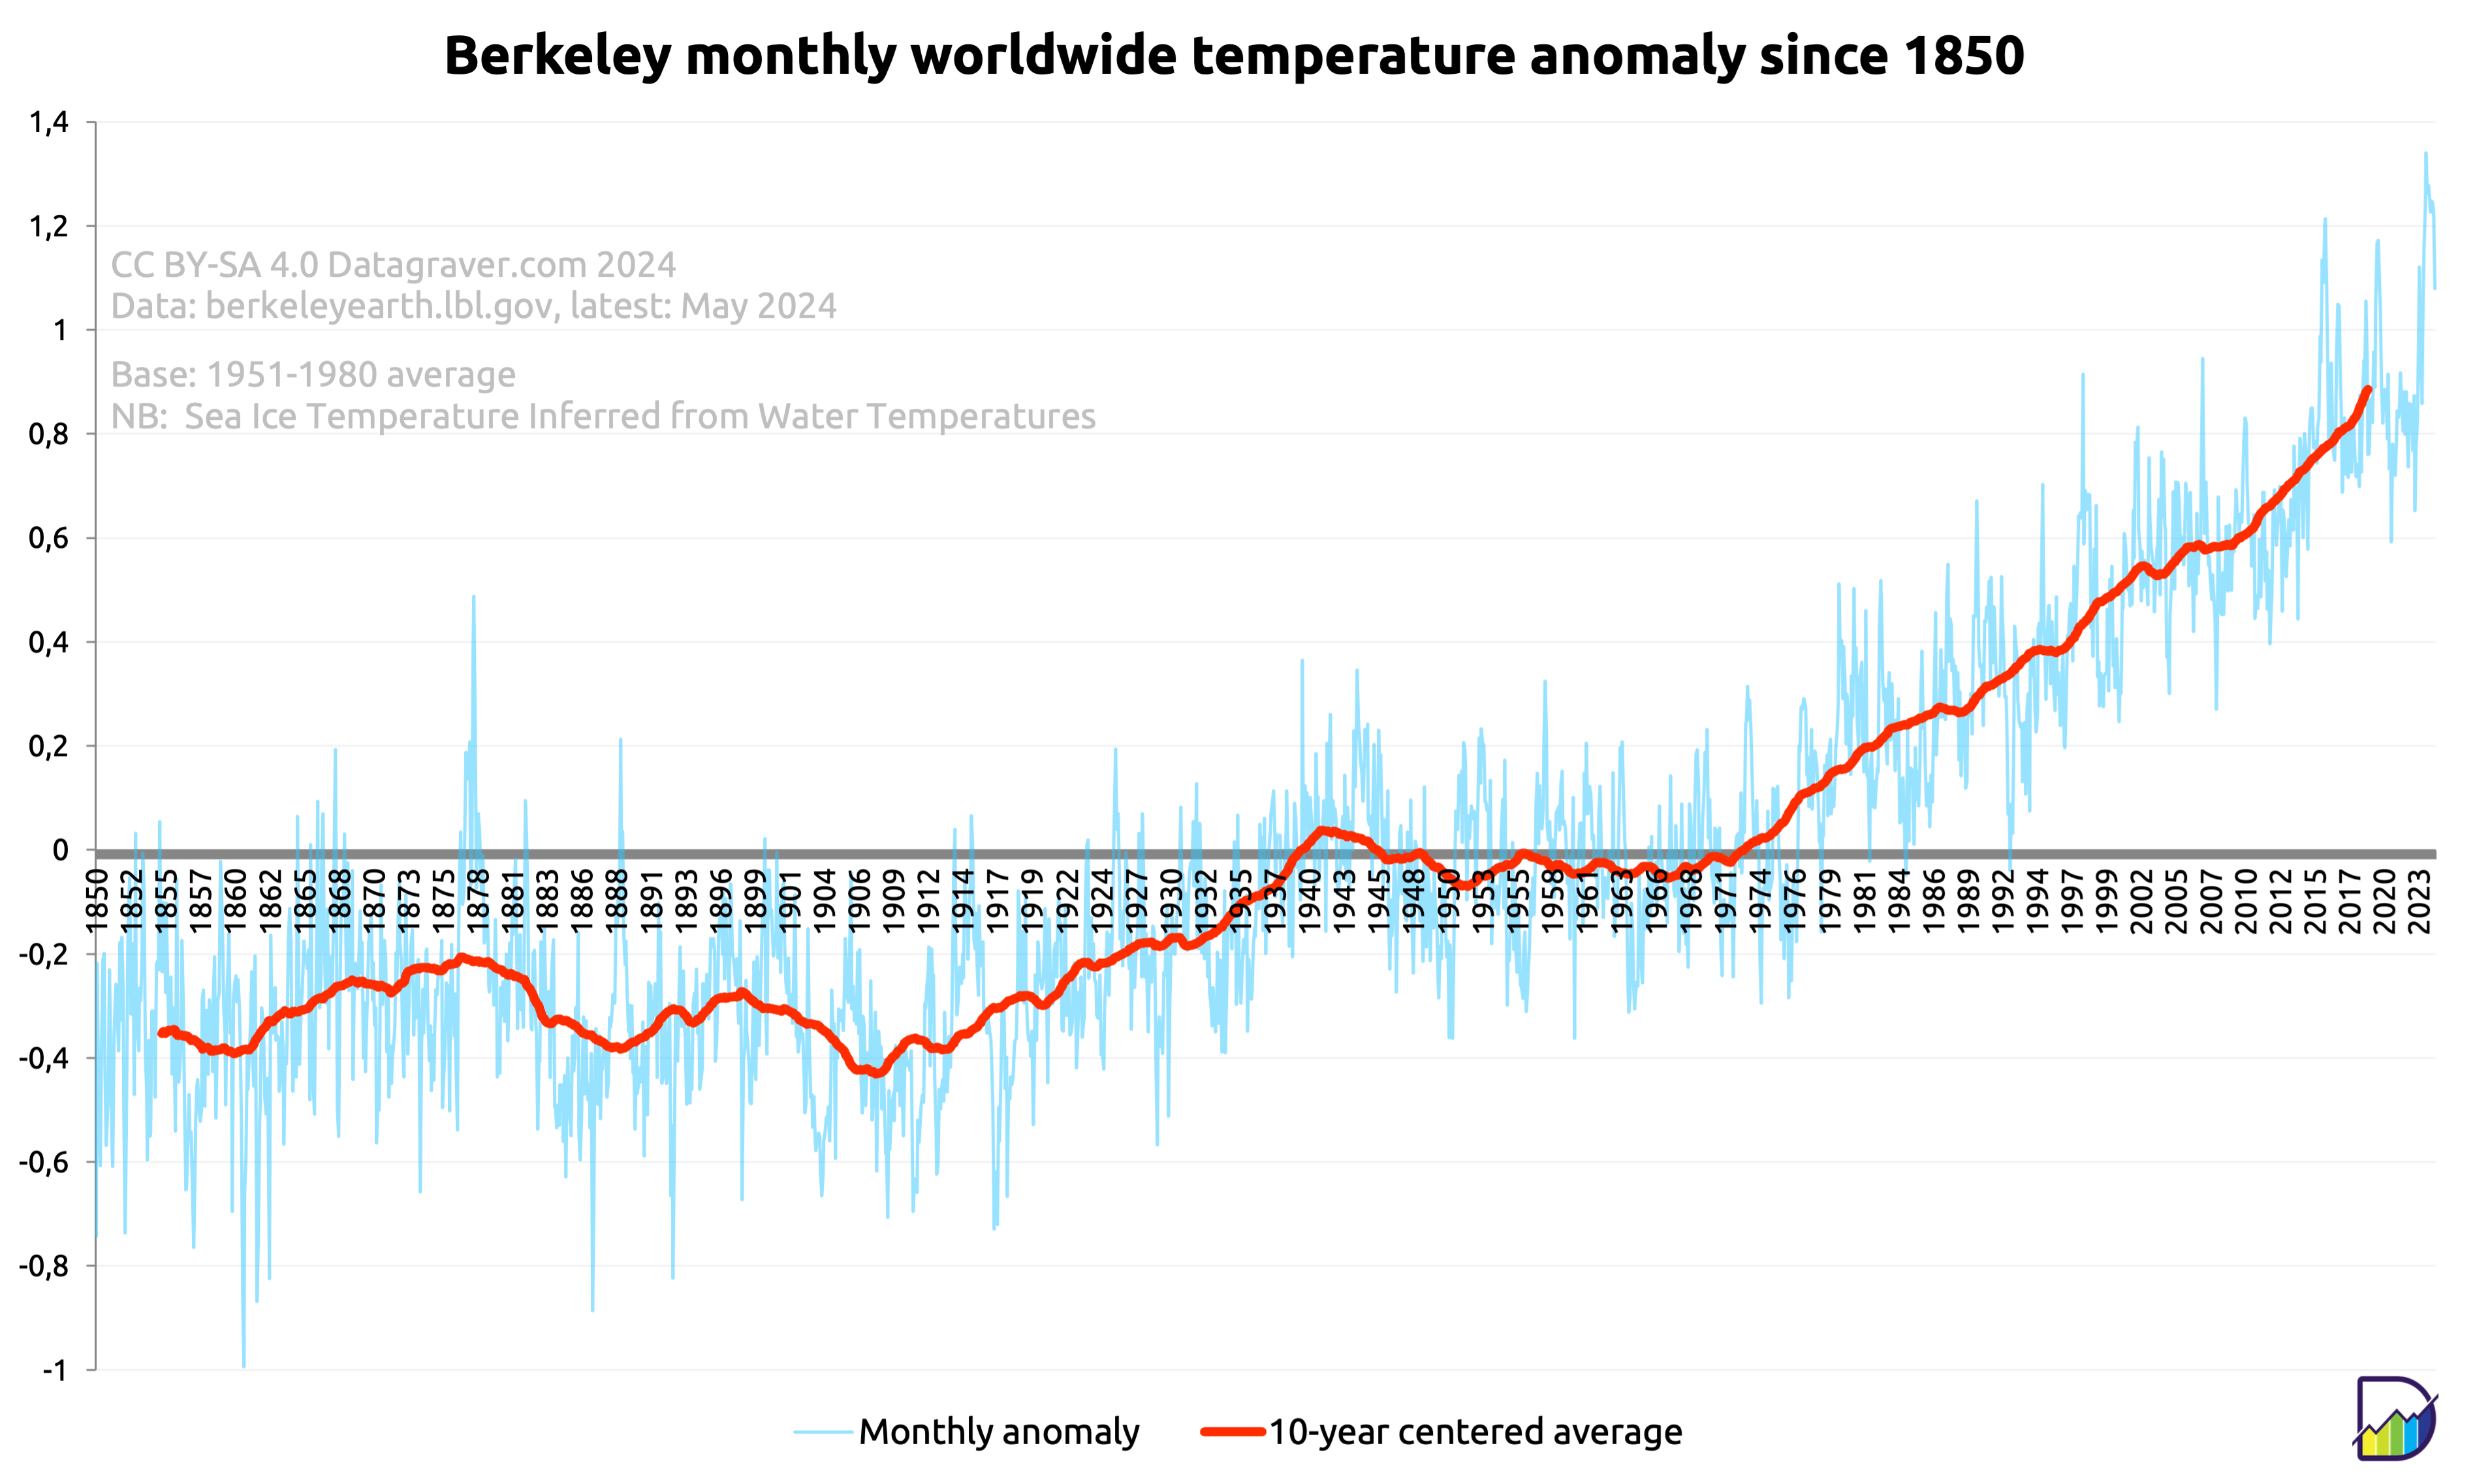
Here graphs based on the Berkeley dataset (reanalysis) created by Berkeley Earth .
Regular updates. Check date in graph.
First graph is on the monthly anomalies plus a centered 10 year average.
Here graphs based on the GISS dataset created by NASA.
Regular updates. Check date in graph.
First graph is on the monthly anomalies plus a 10 year average.
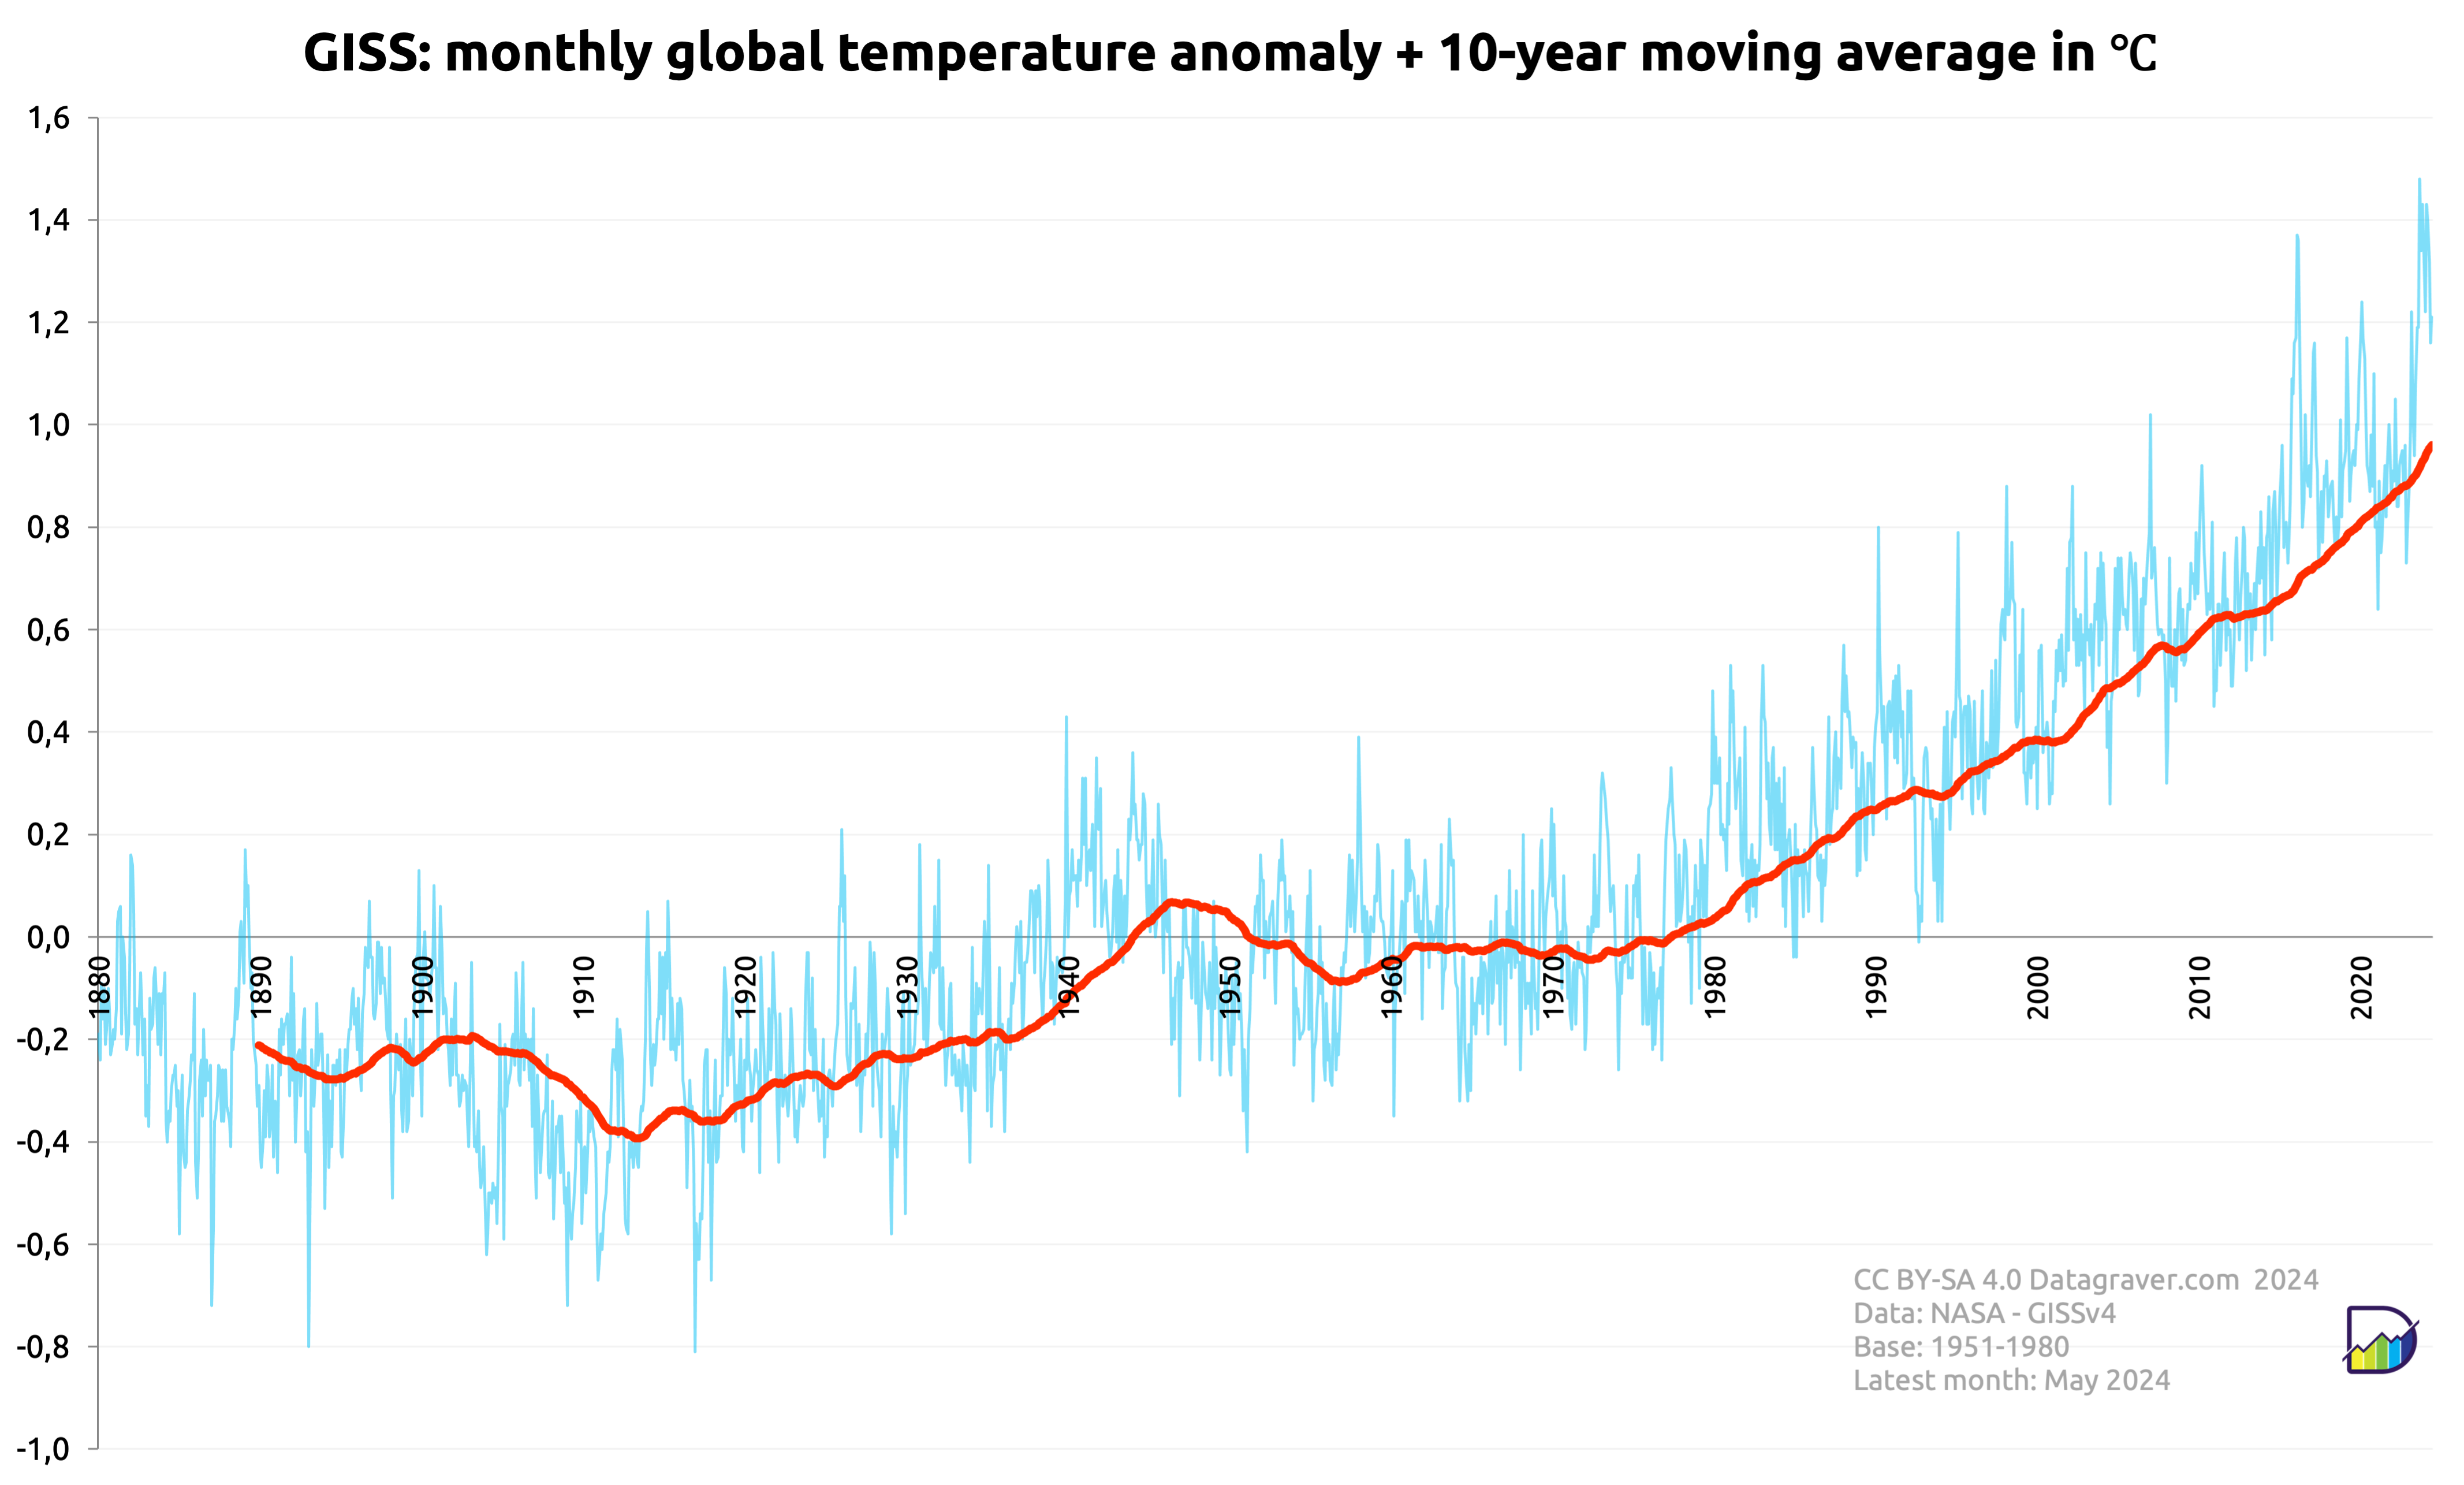
Then the yearly averages on the monthly anomalies.
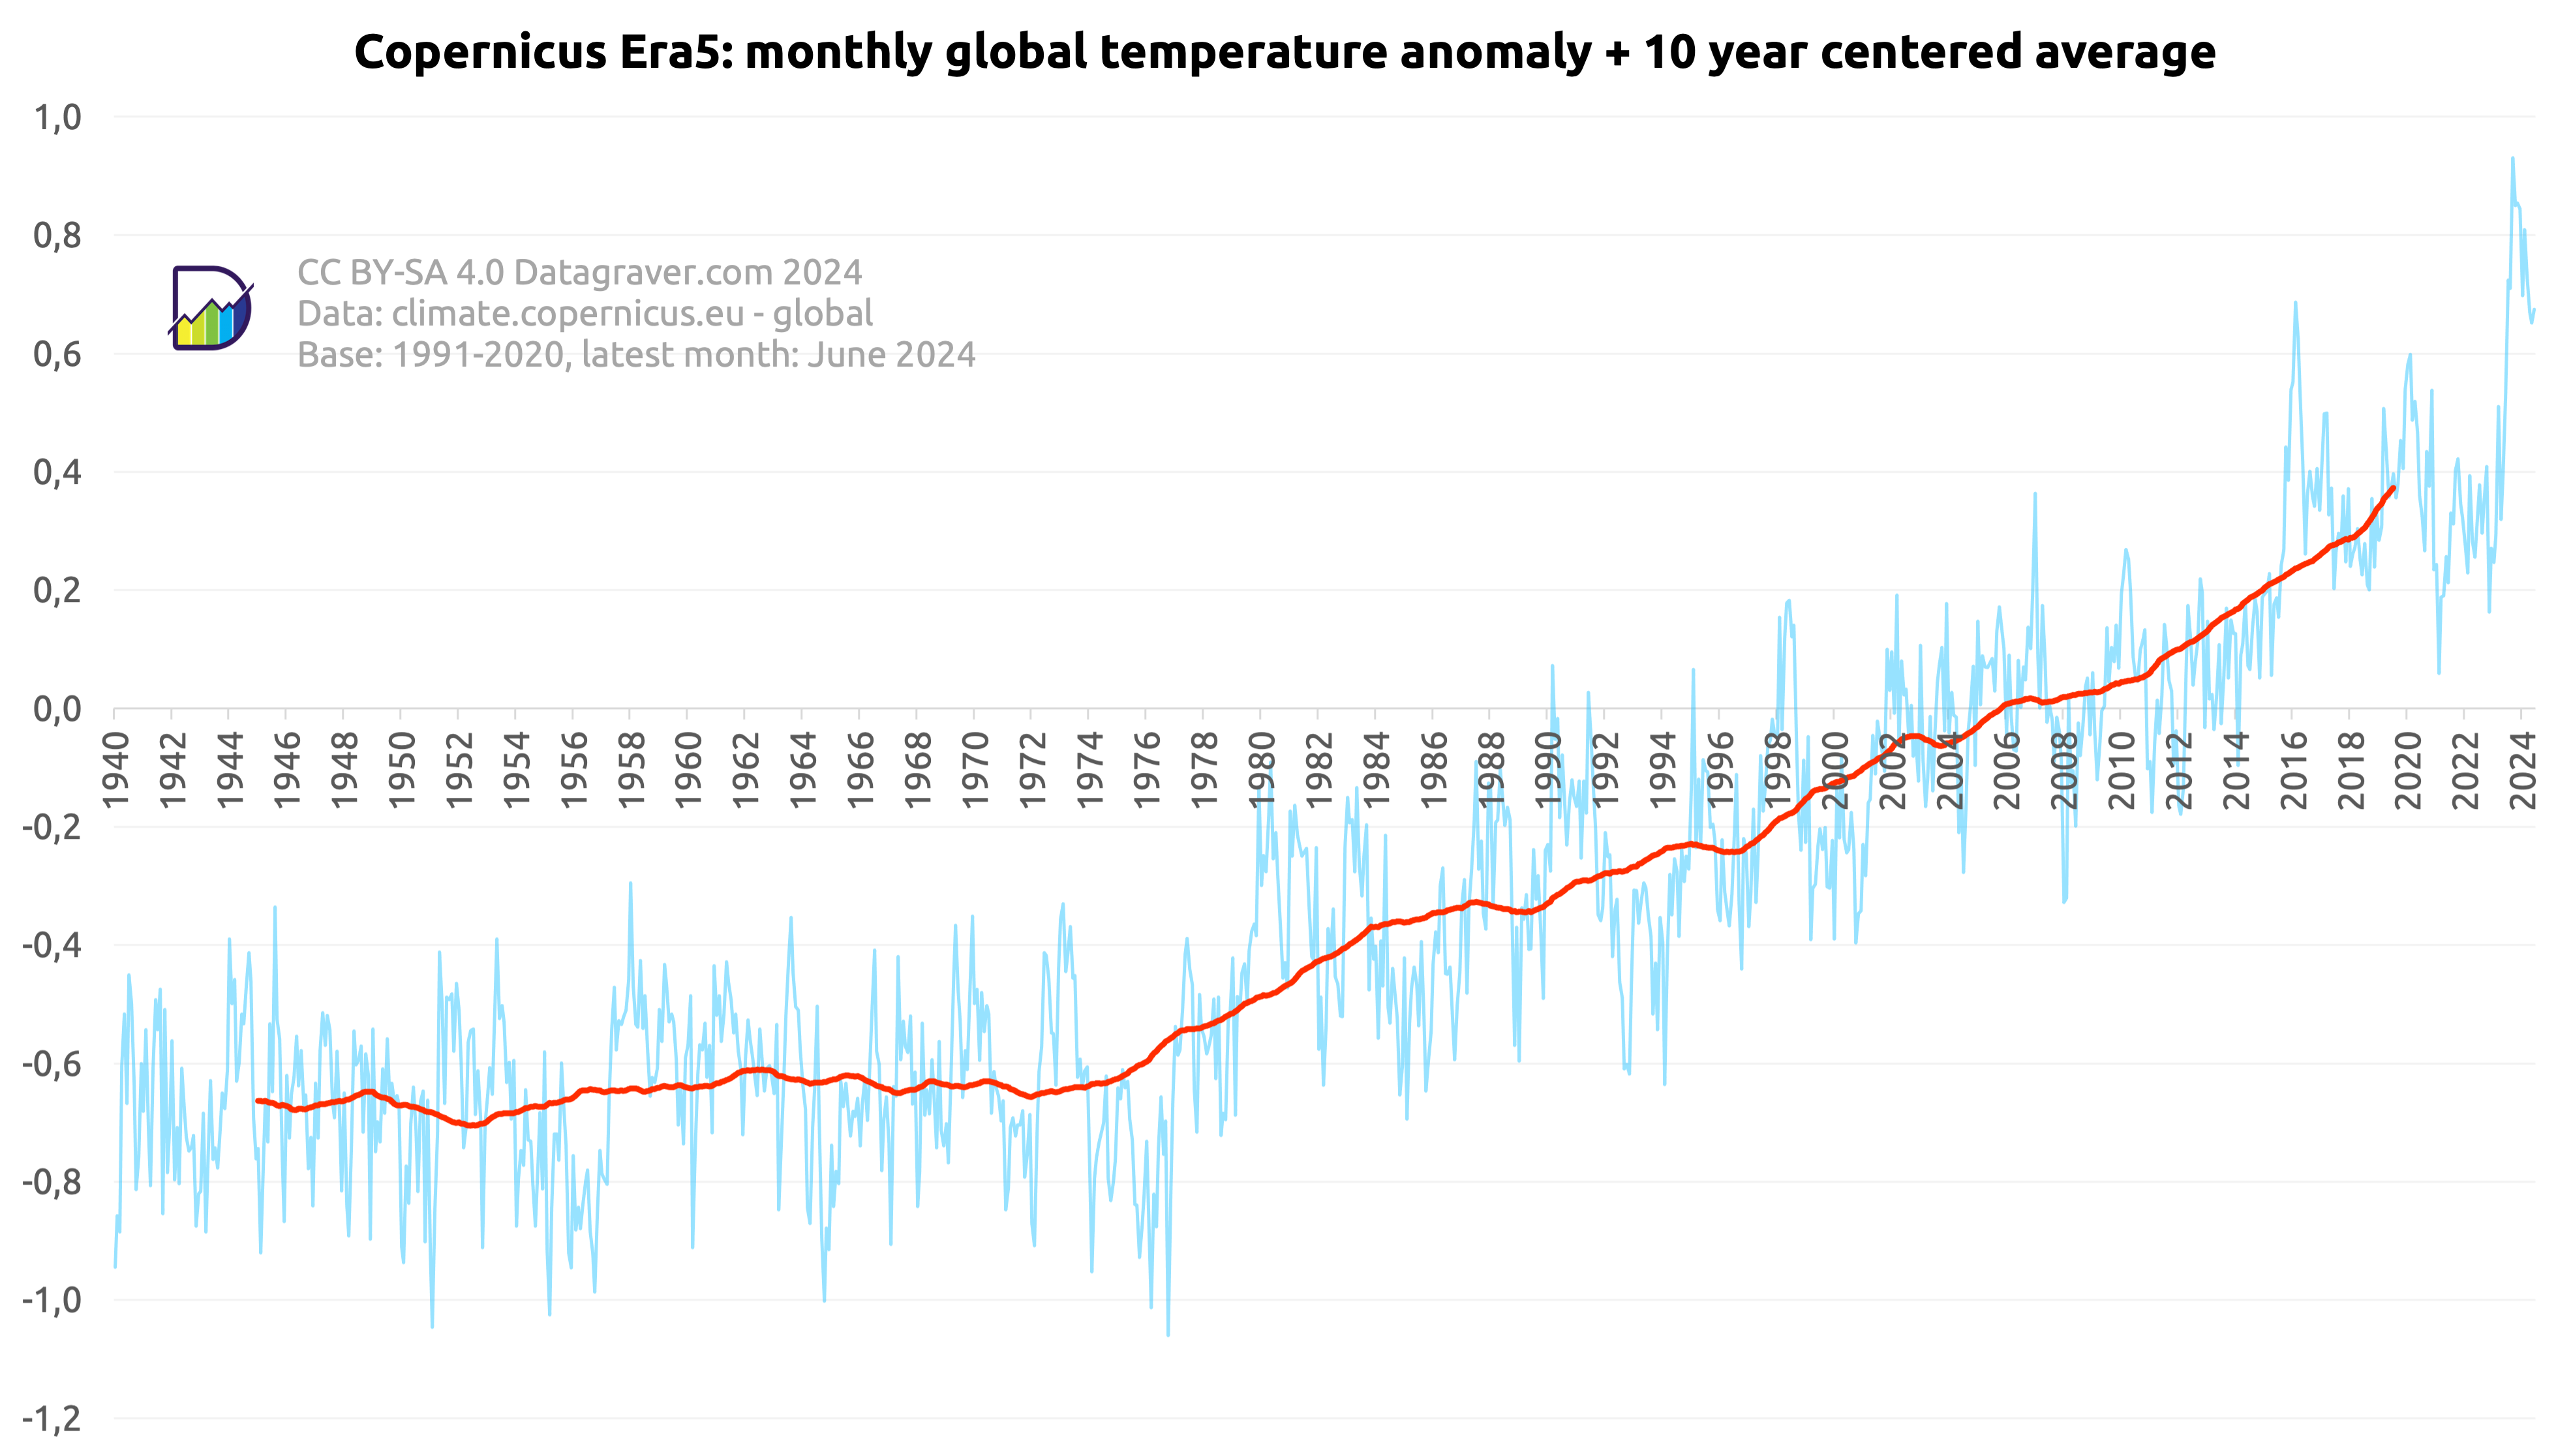
Read moreHere graphs based on the climate data set created by Copernicus Programme as implemented by ECMWF, supplemented with the data from 1940 to 1978.
Regular updates. Check date in graph.
First graph is on the monthly anomalies plus a 10 year centered average.
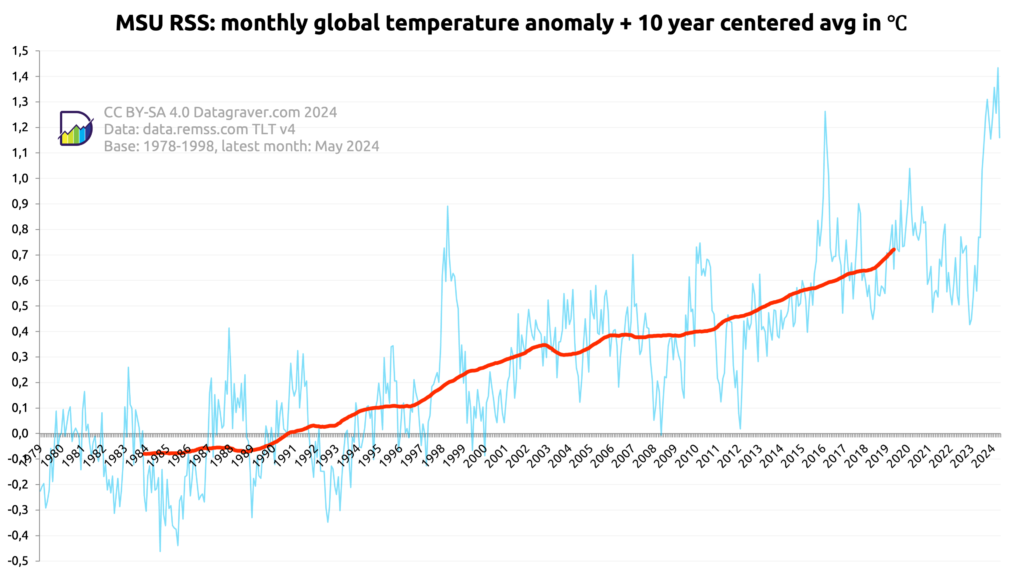
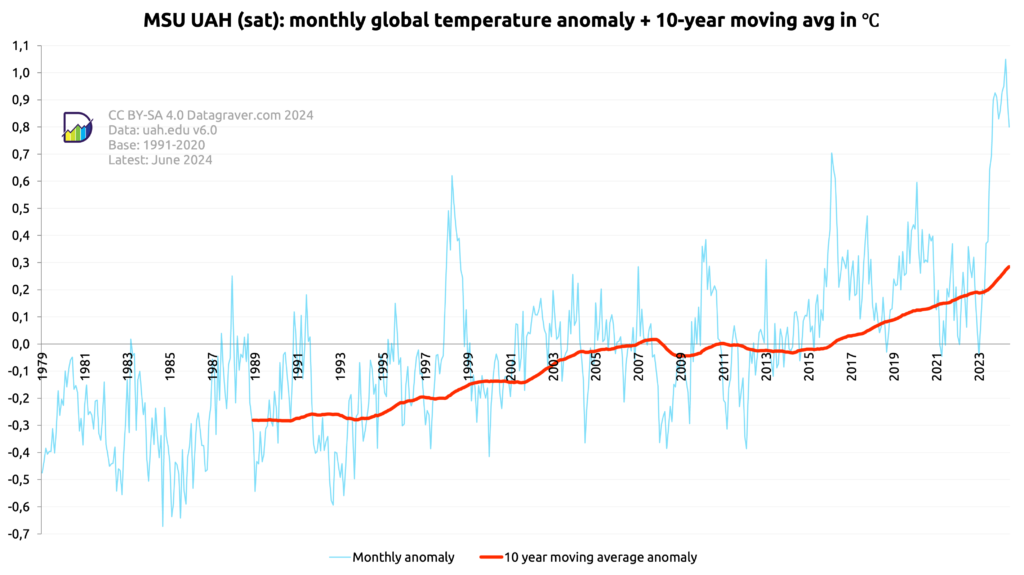
Here graphs based on the MSU UAH dataset (satellite) created by John Christy/Roy Spencer.
Regular updates. Check date in graph.
First graph is on the monthly anomalies plus a moving 10 year average.
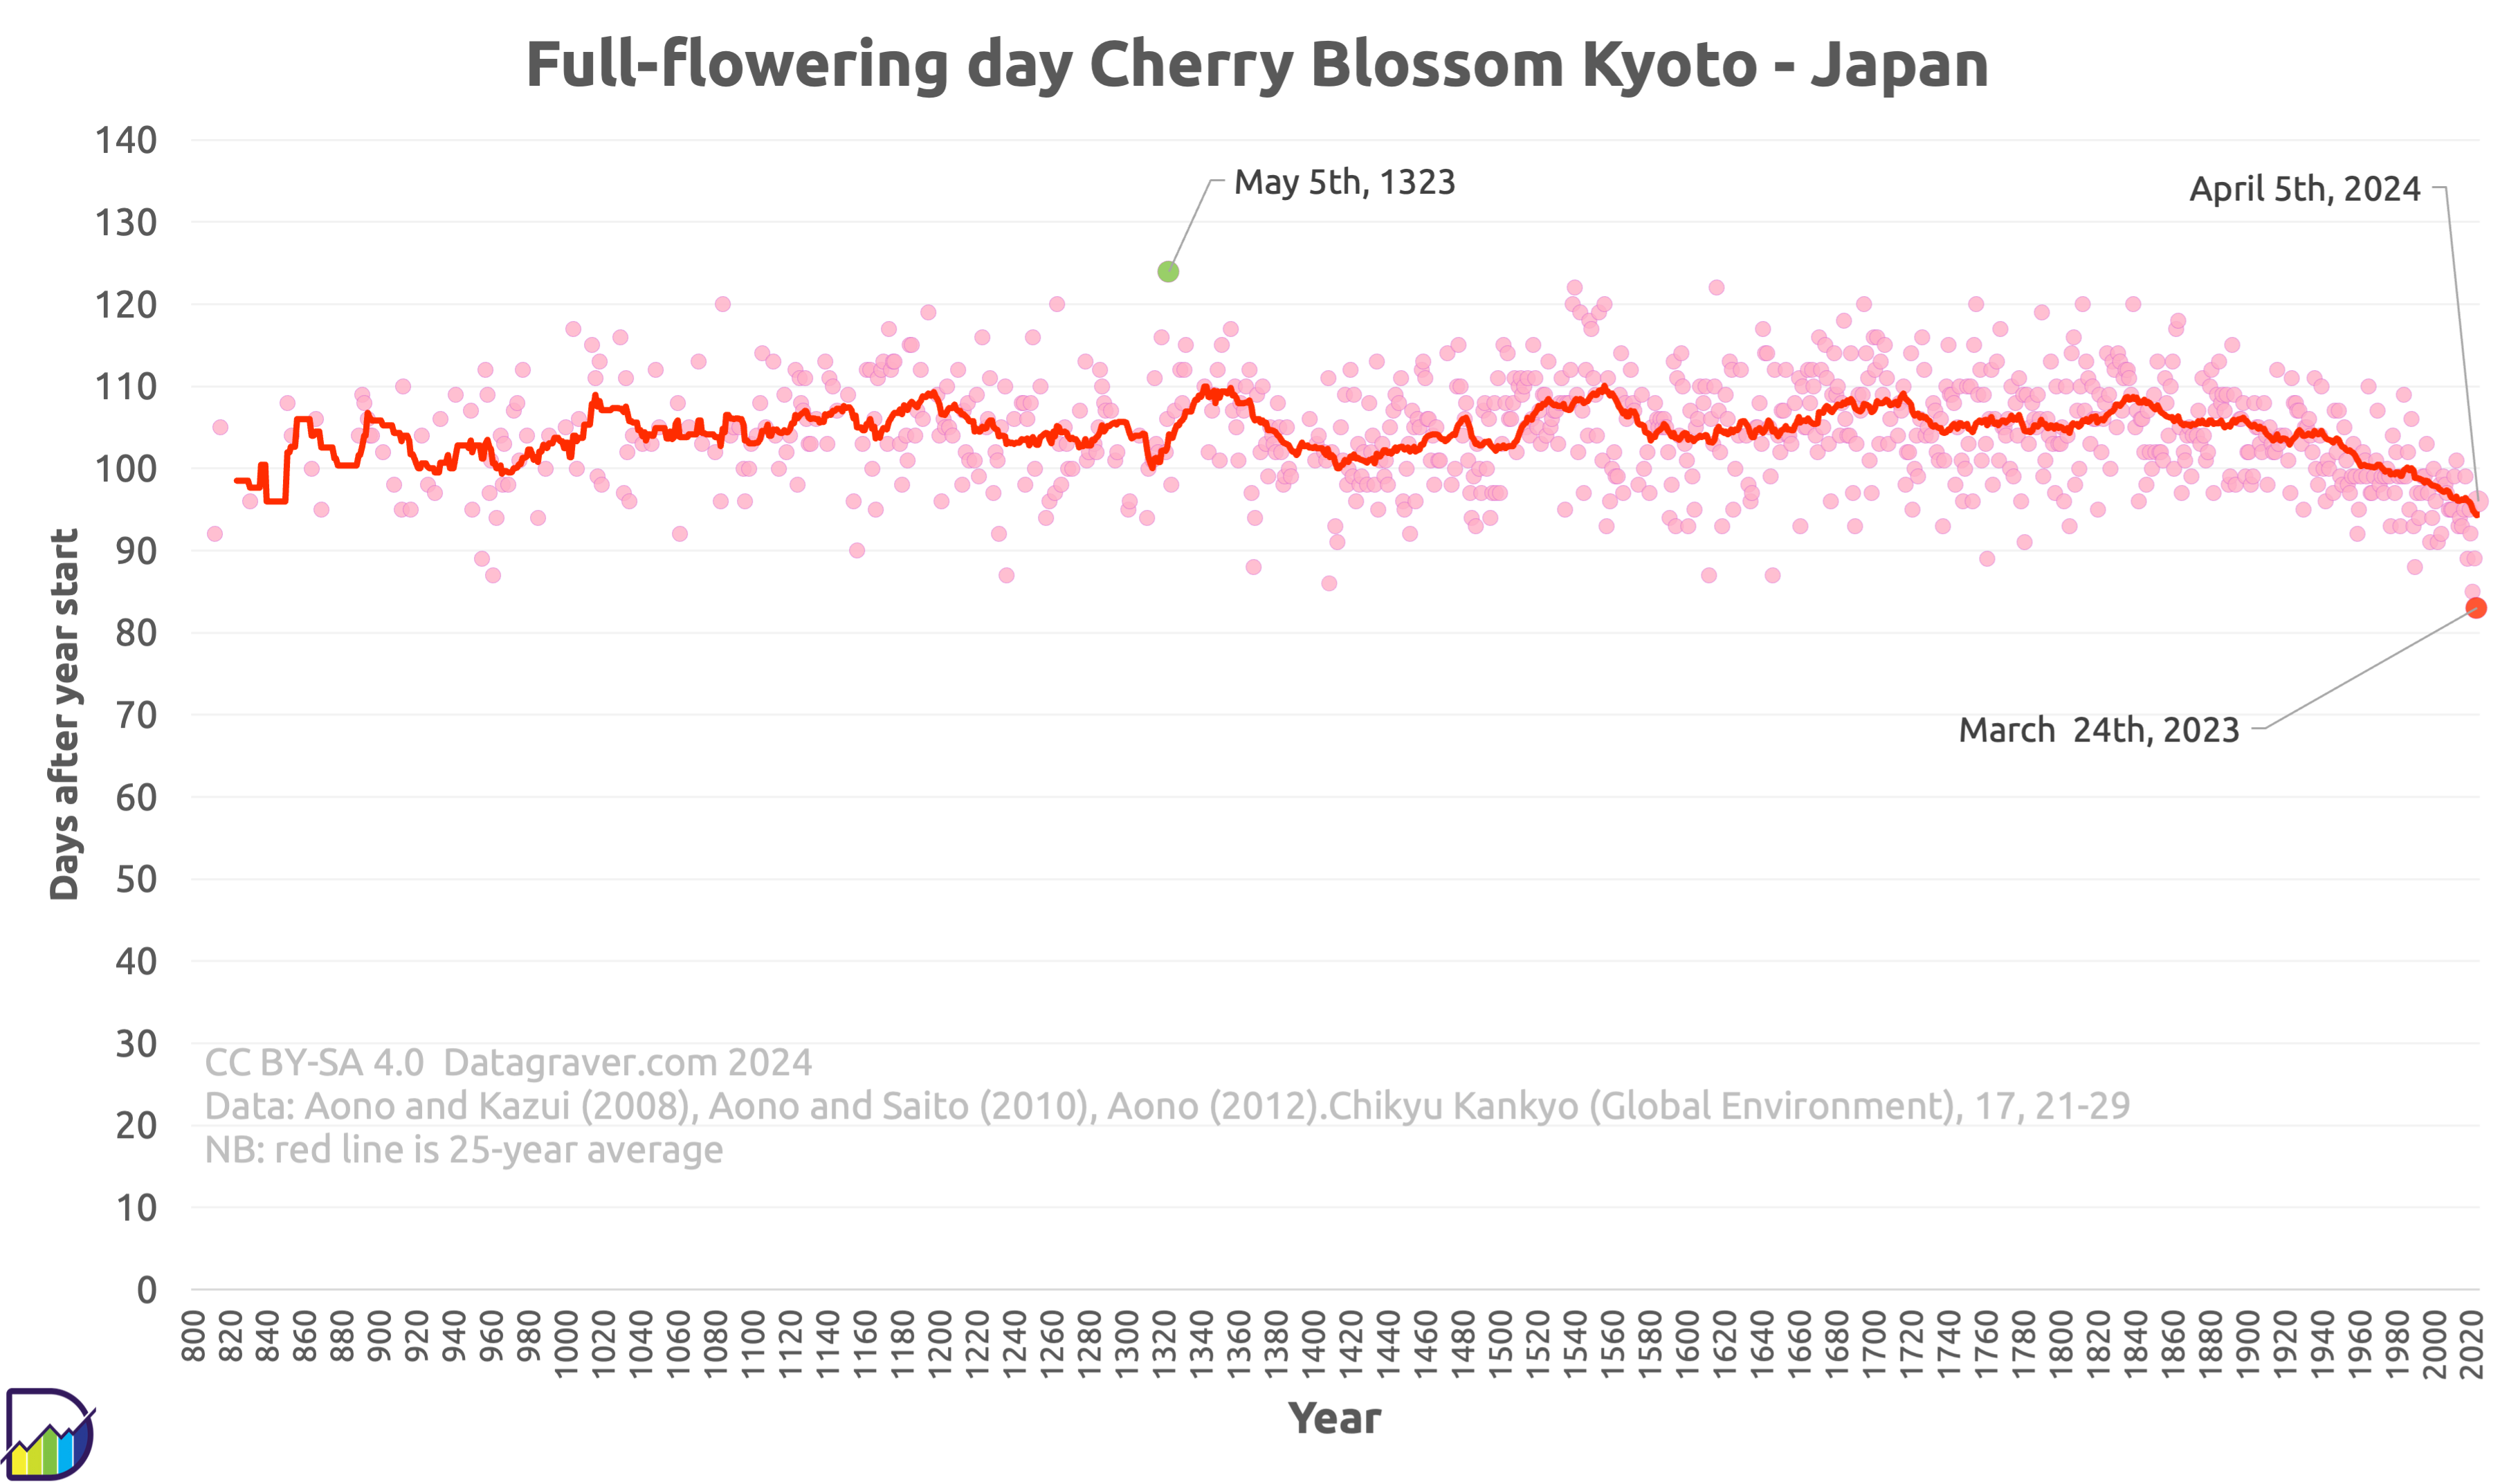
Based on the research done by Aono and Kazui in 2008, by Aono and Saito in 2010 and by Aono in 2012 the historic full flowering days since the year 812 for Kyoto in Japan where gathered.
Yearly we add the new dates and update the graph. The current version is up to date till 2023.