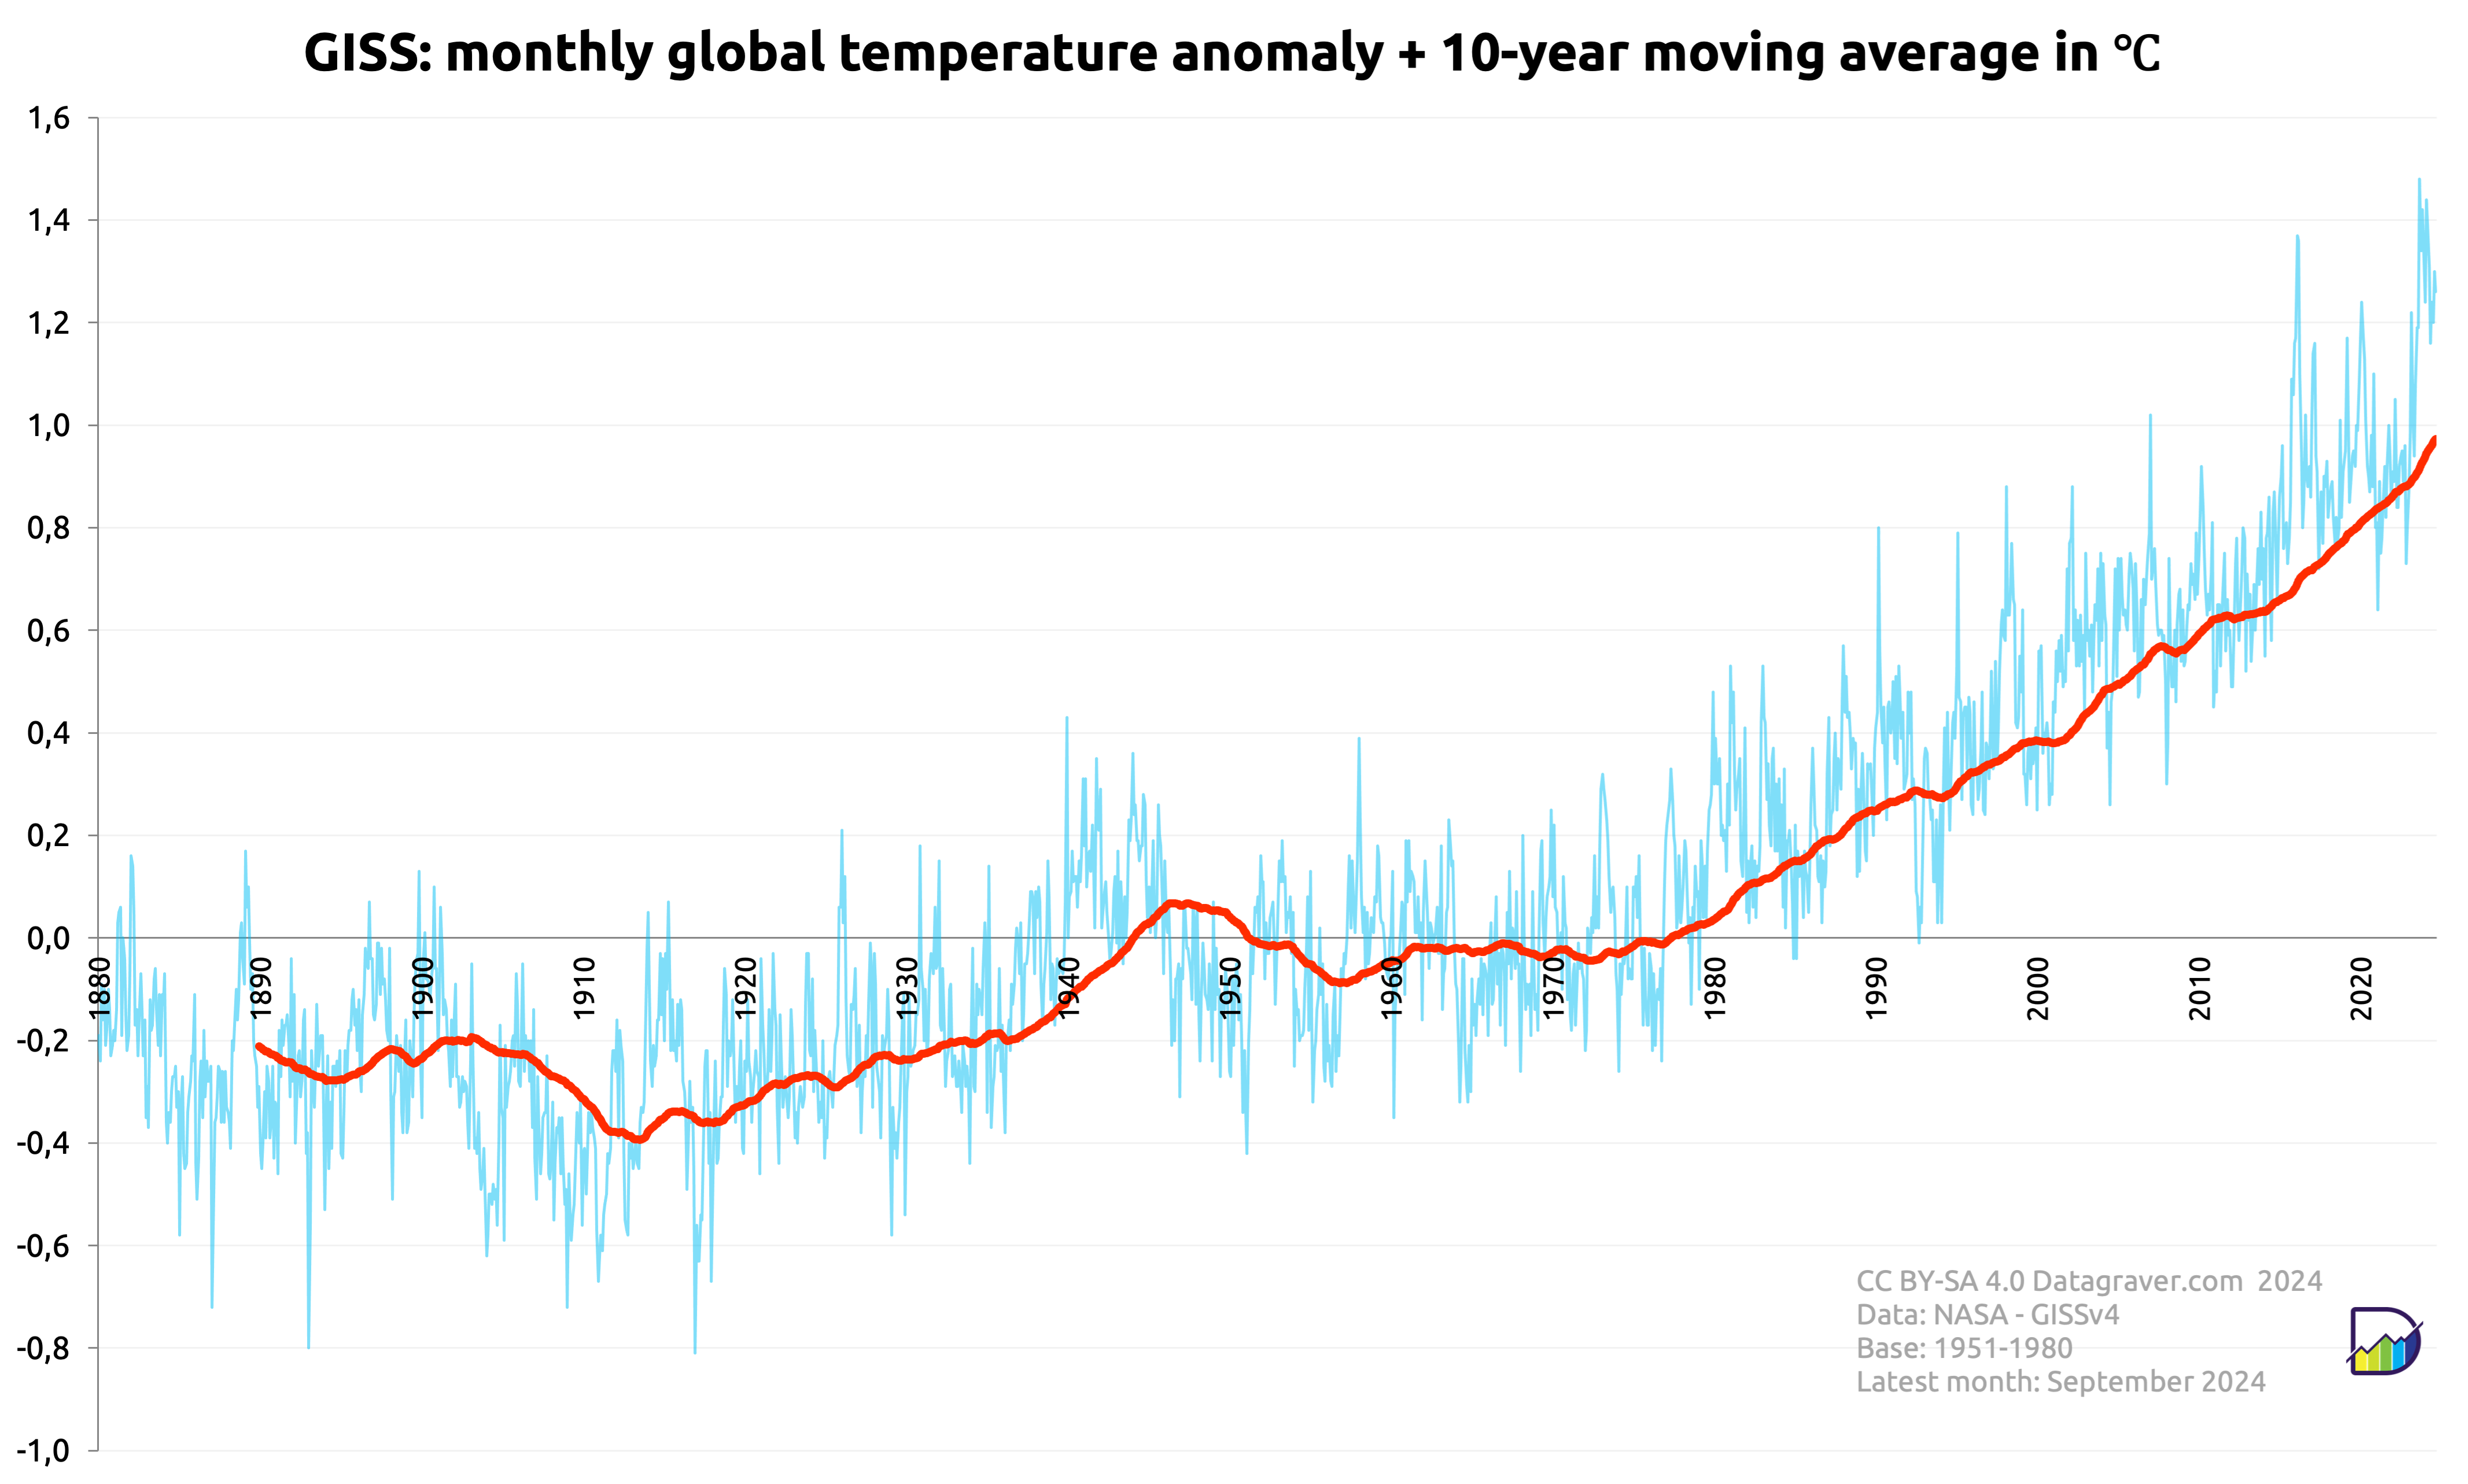
Here graphs based on the GISS dataset created by NASA.
Regular updates. Check date in graph.
First graph is on the monthly anomalies plus a 10 year average.
Then the yearly averages on the monthly anomalies.
Read moreDigging data
Posts about things in the world, in English.
Here graphs based on the GISS dataset created by NASA.
Regular updates. Check date in graph.
First graph is on the monthly anomalies plus a 10 year average.
Then the yearly averages on the monthly anomalies.
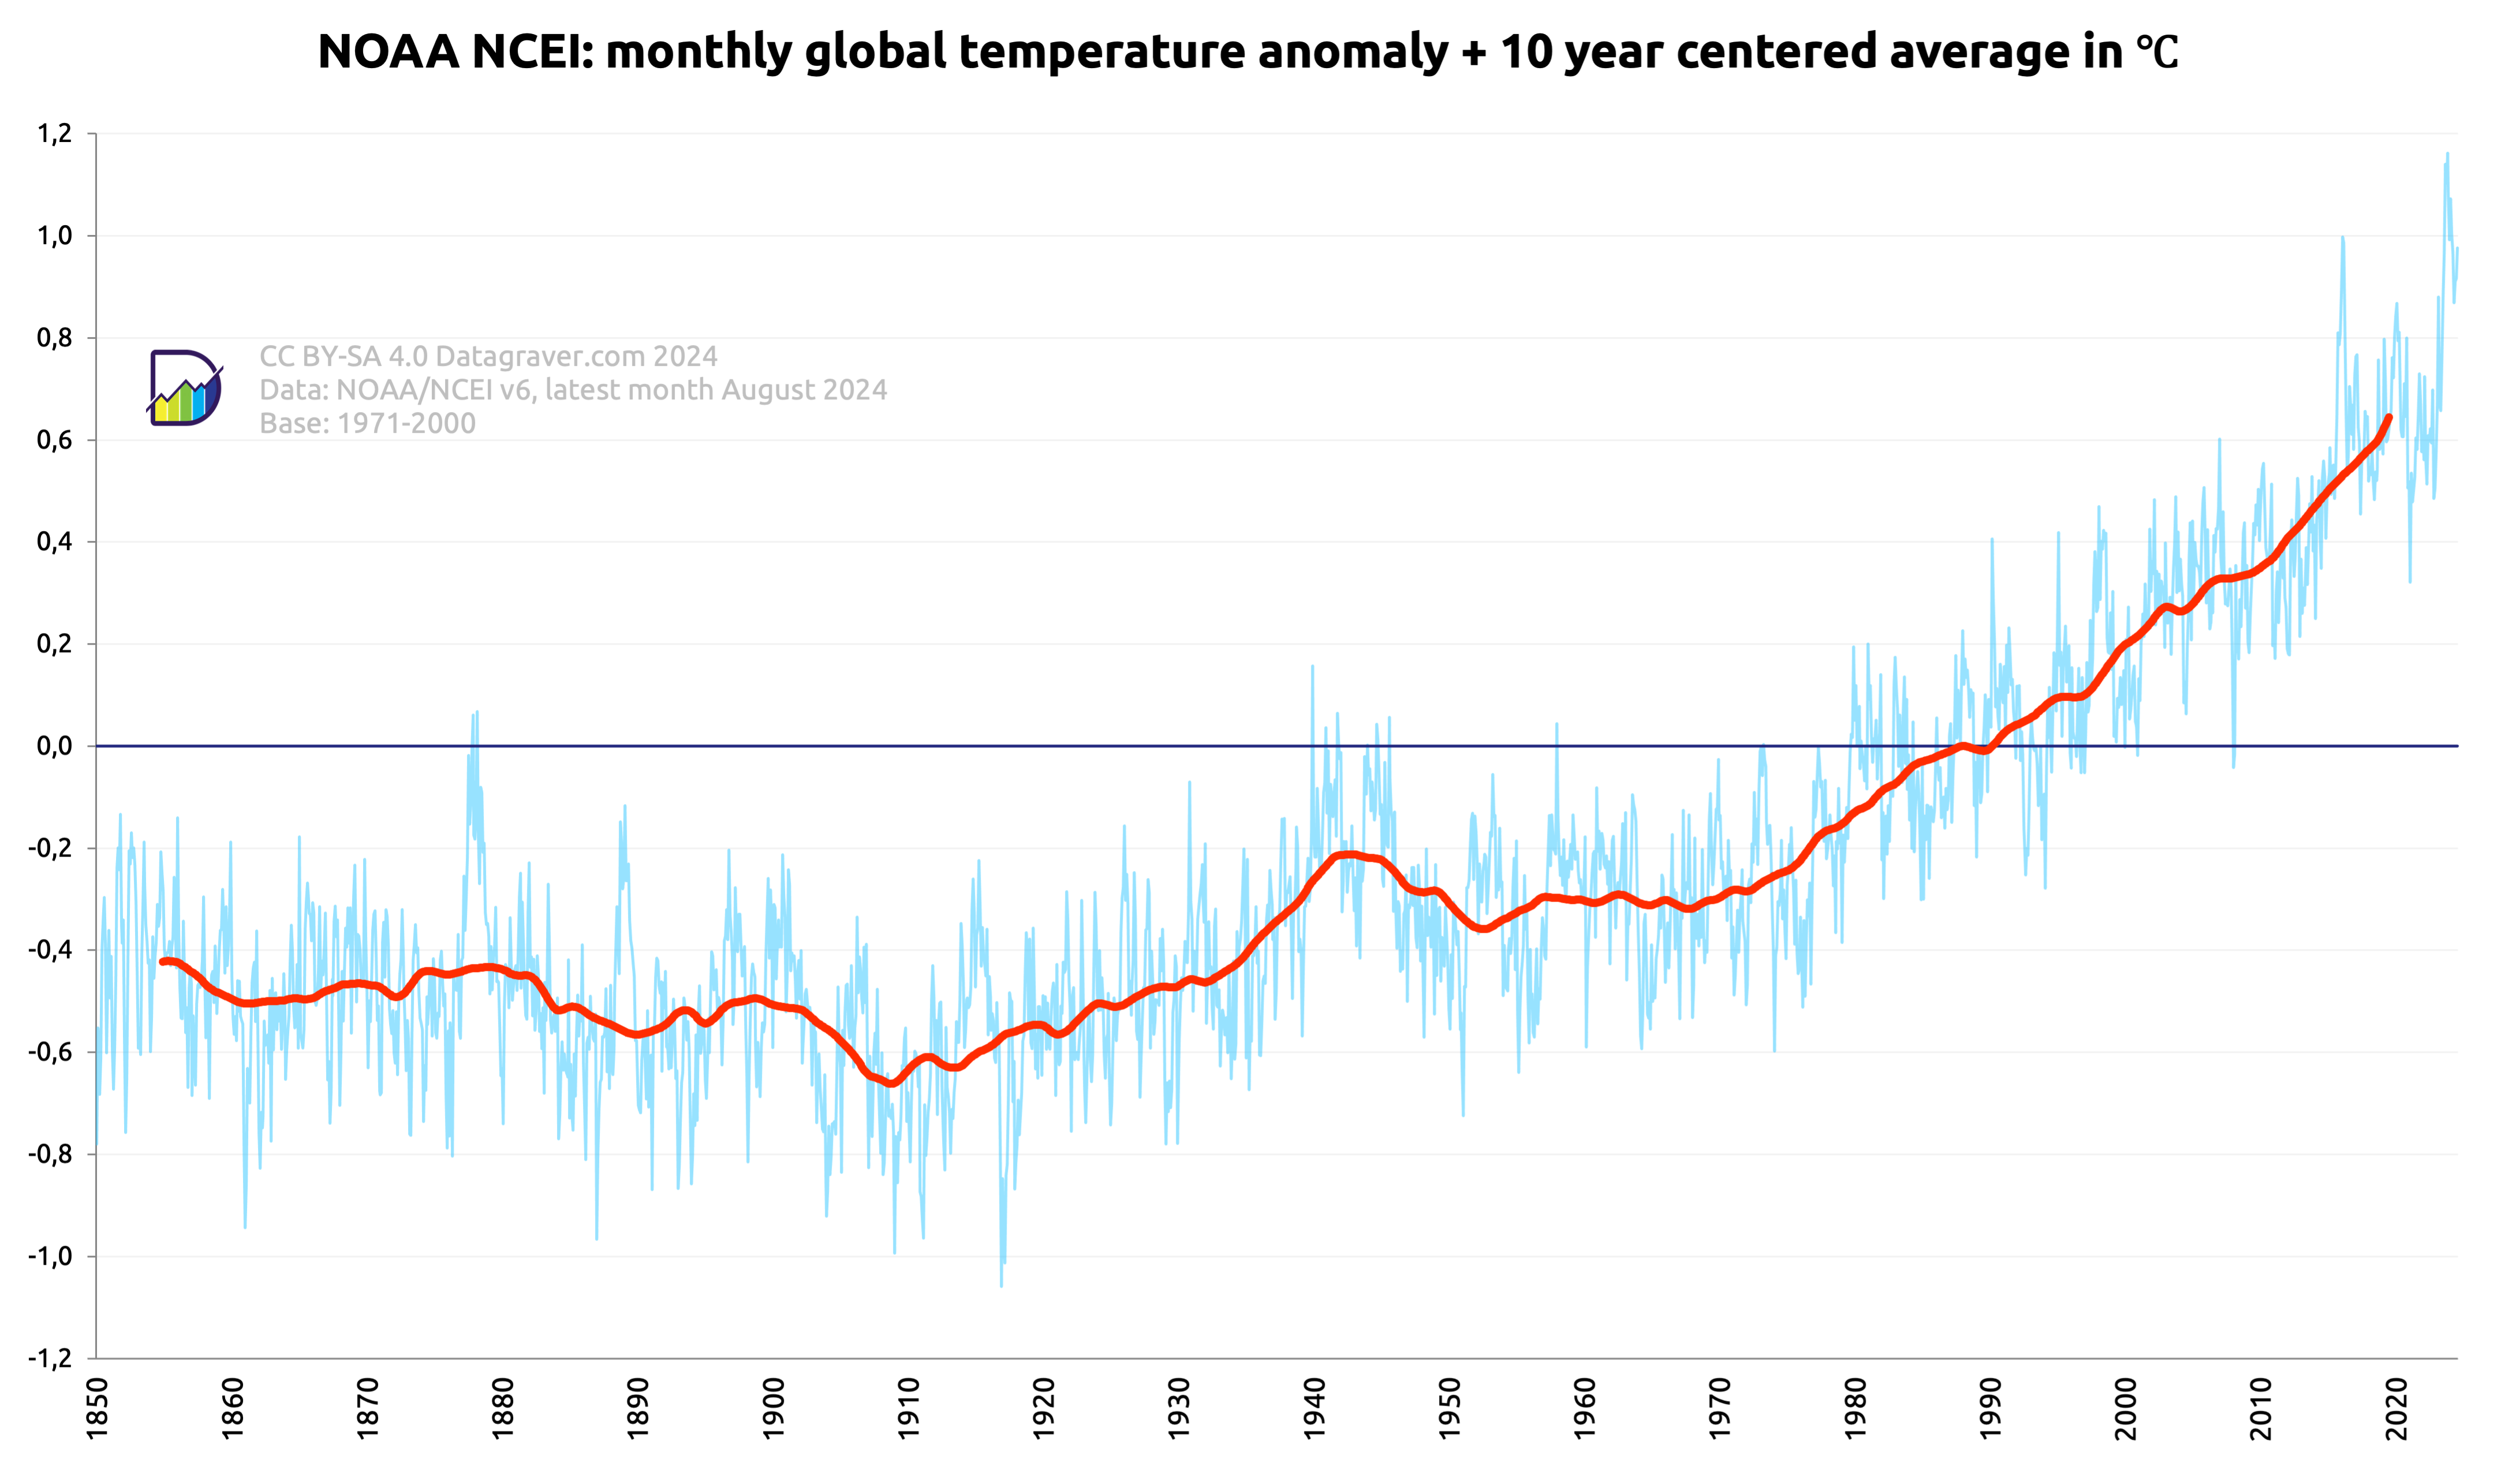
Read moreHere graphs based on the V6.0 NOAAGlobalTemp dataset created by NOAA/NCEI.
Regular updates. Check date in graph.
First graph is on the monthly anomalies plus a centered 10 year average.
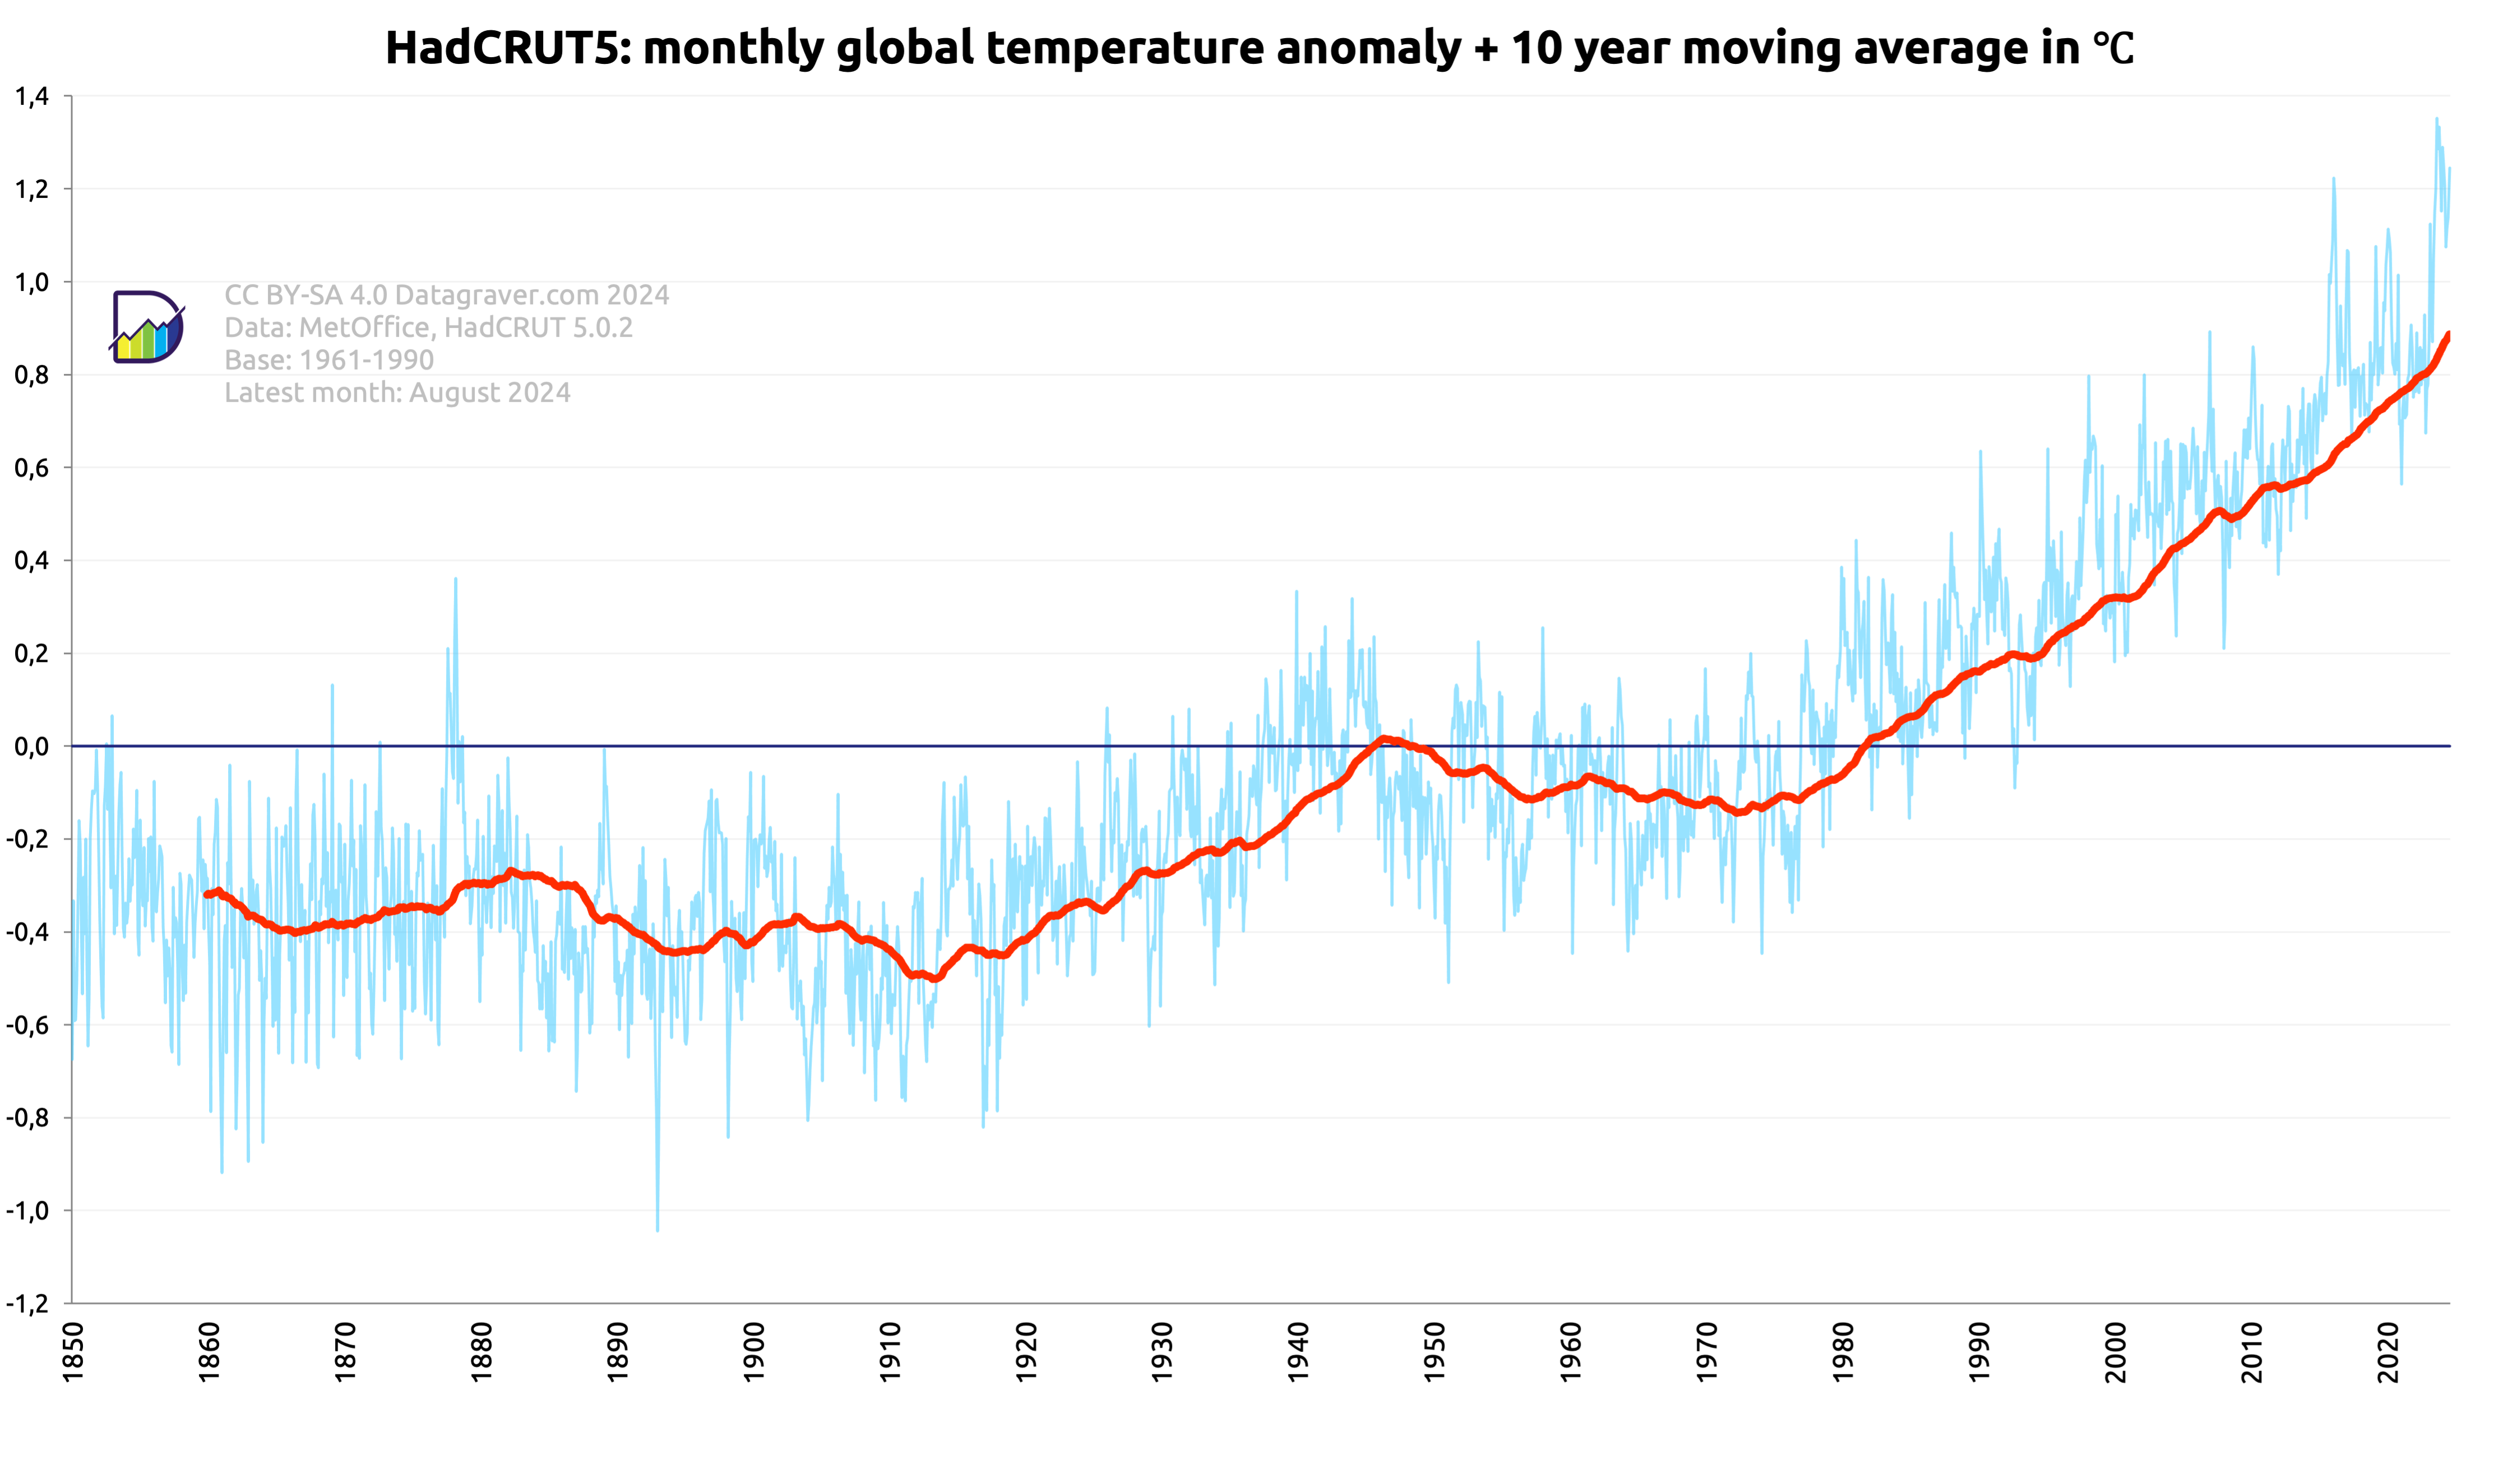
Here graphs based on the HadCRUT 5.0.2 dataset created by the Met Office (UK).
Regular updates. Check date in graph.
First graph is on the monthly anomalies plus a moving 10 year average.
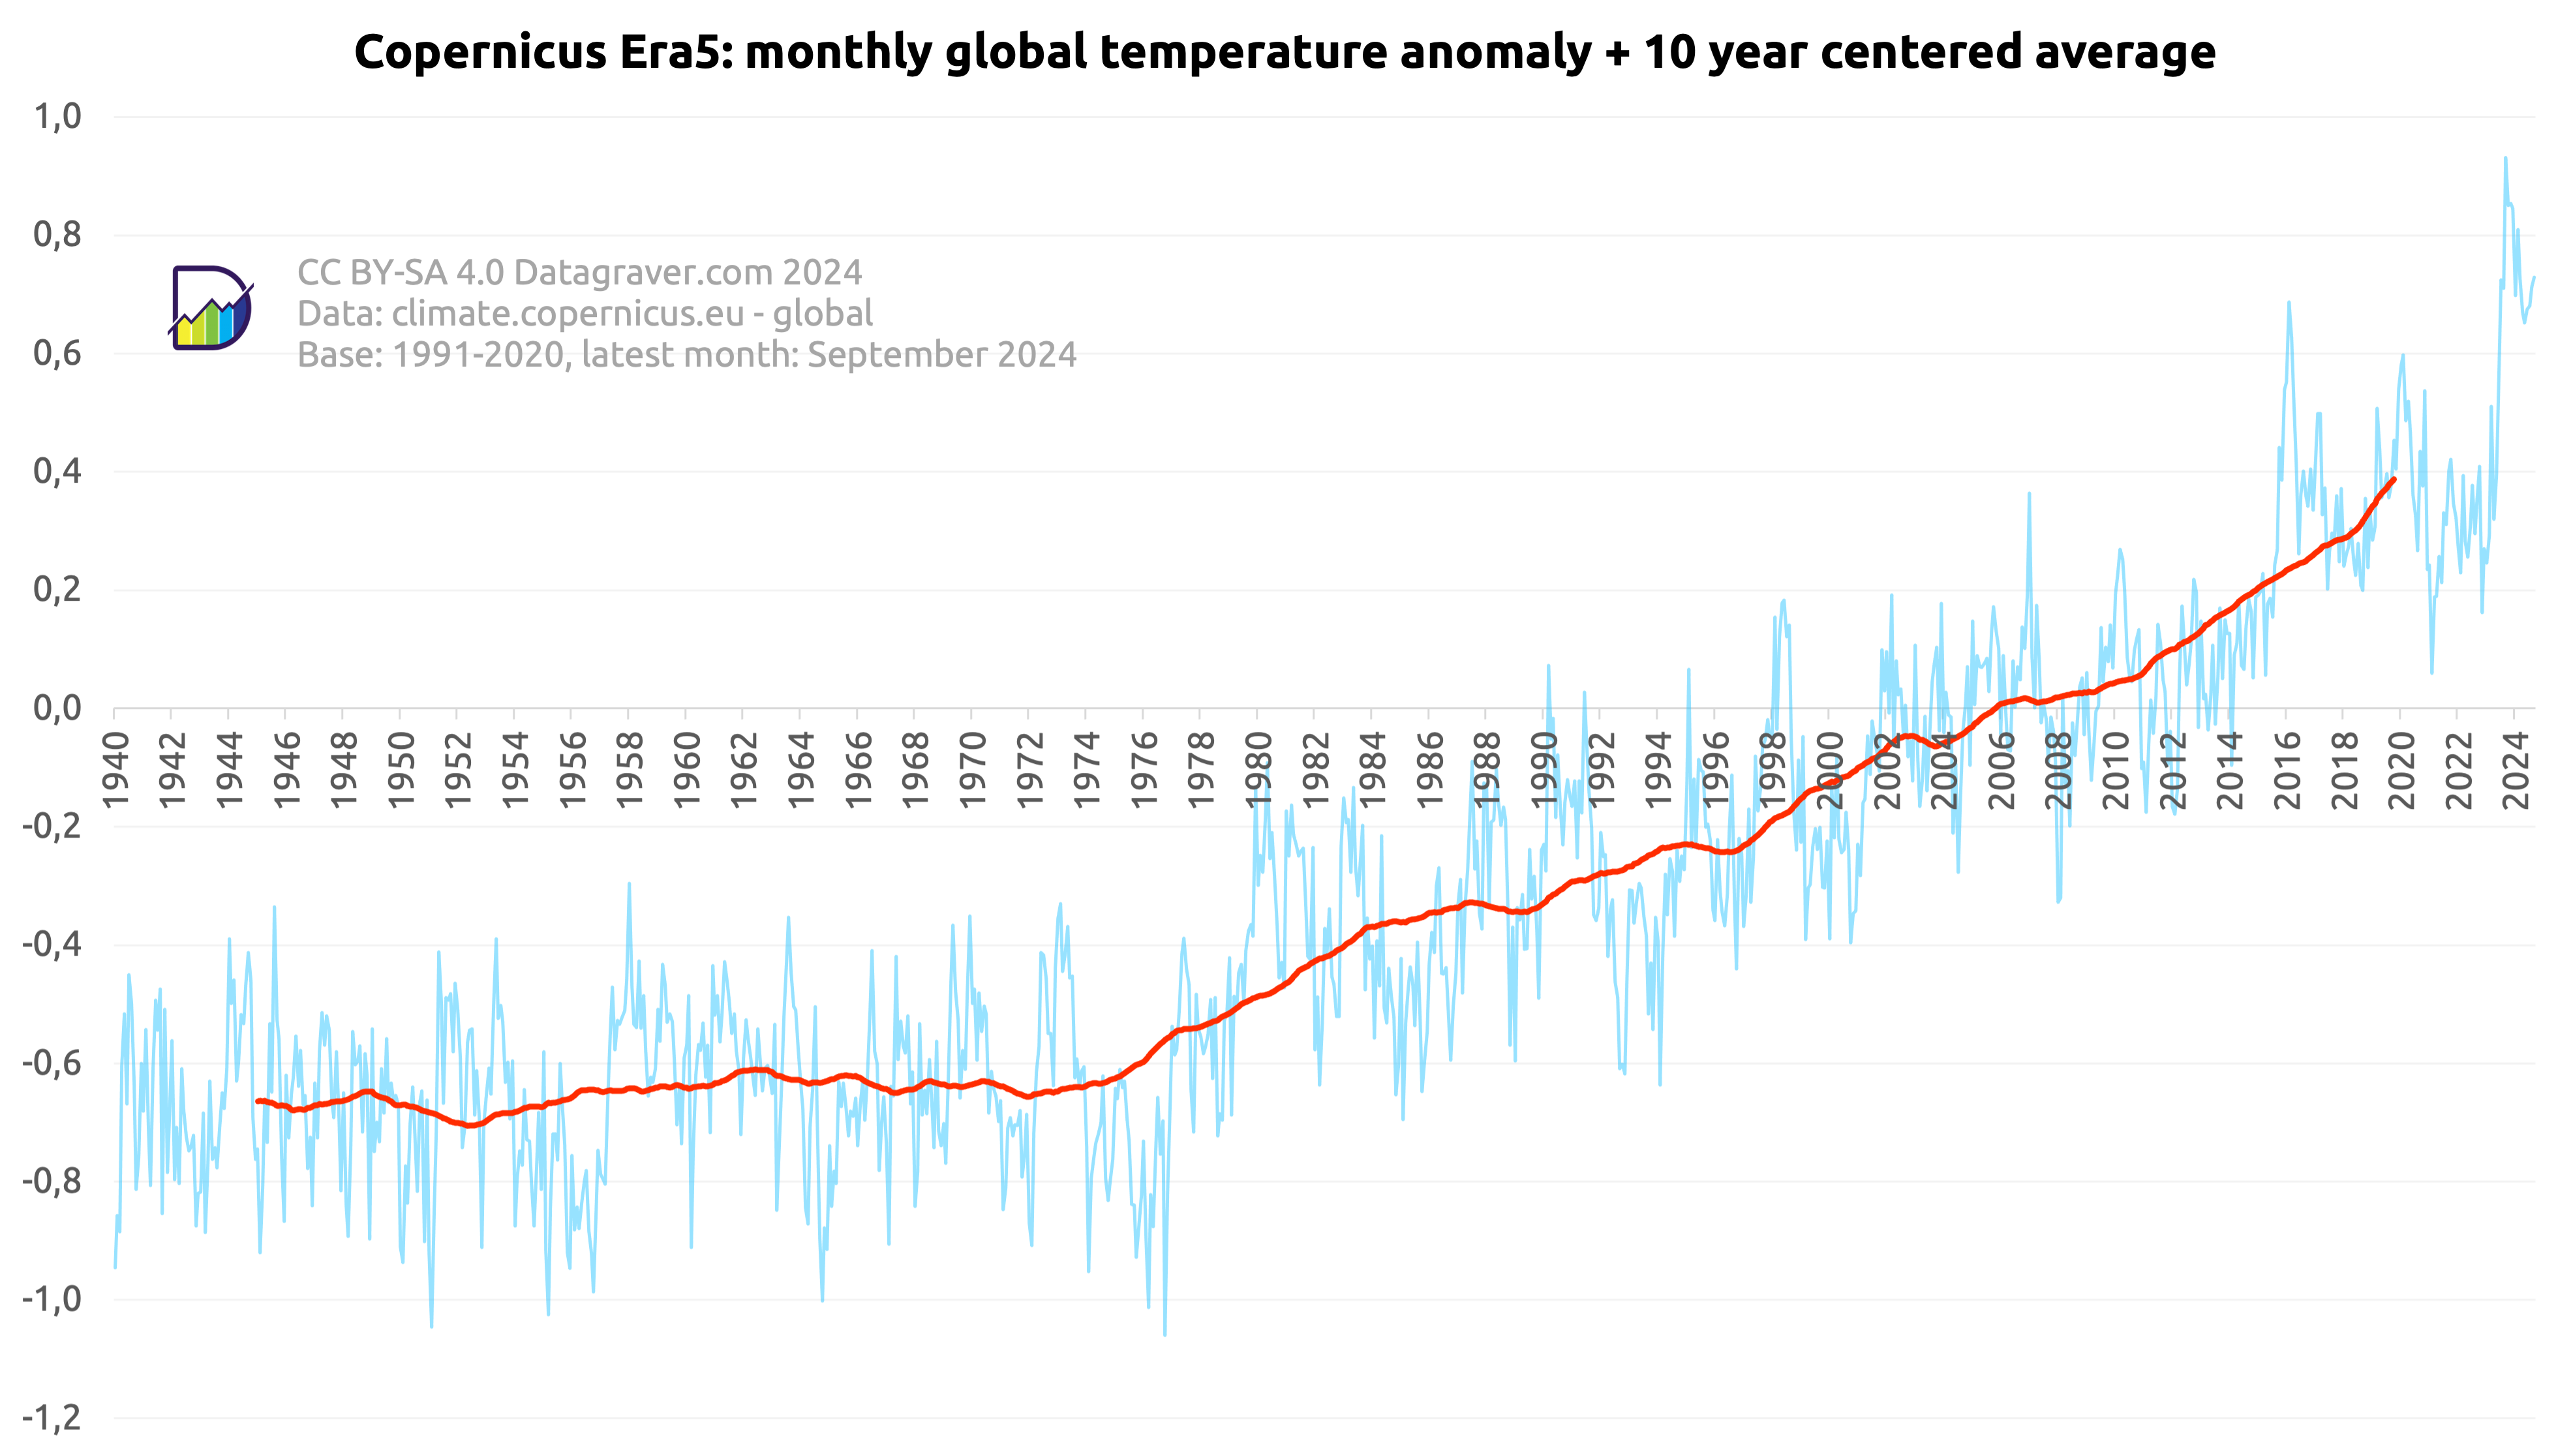
Here graphs based on the climate data set created by Copernicus Programme as implemented by ECMWF, supplemented with the data from 1940 to 1978.
Regular updates. Check date in graph.
First graph is on the monthly anomalies plus a 10 year centered average.
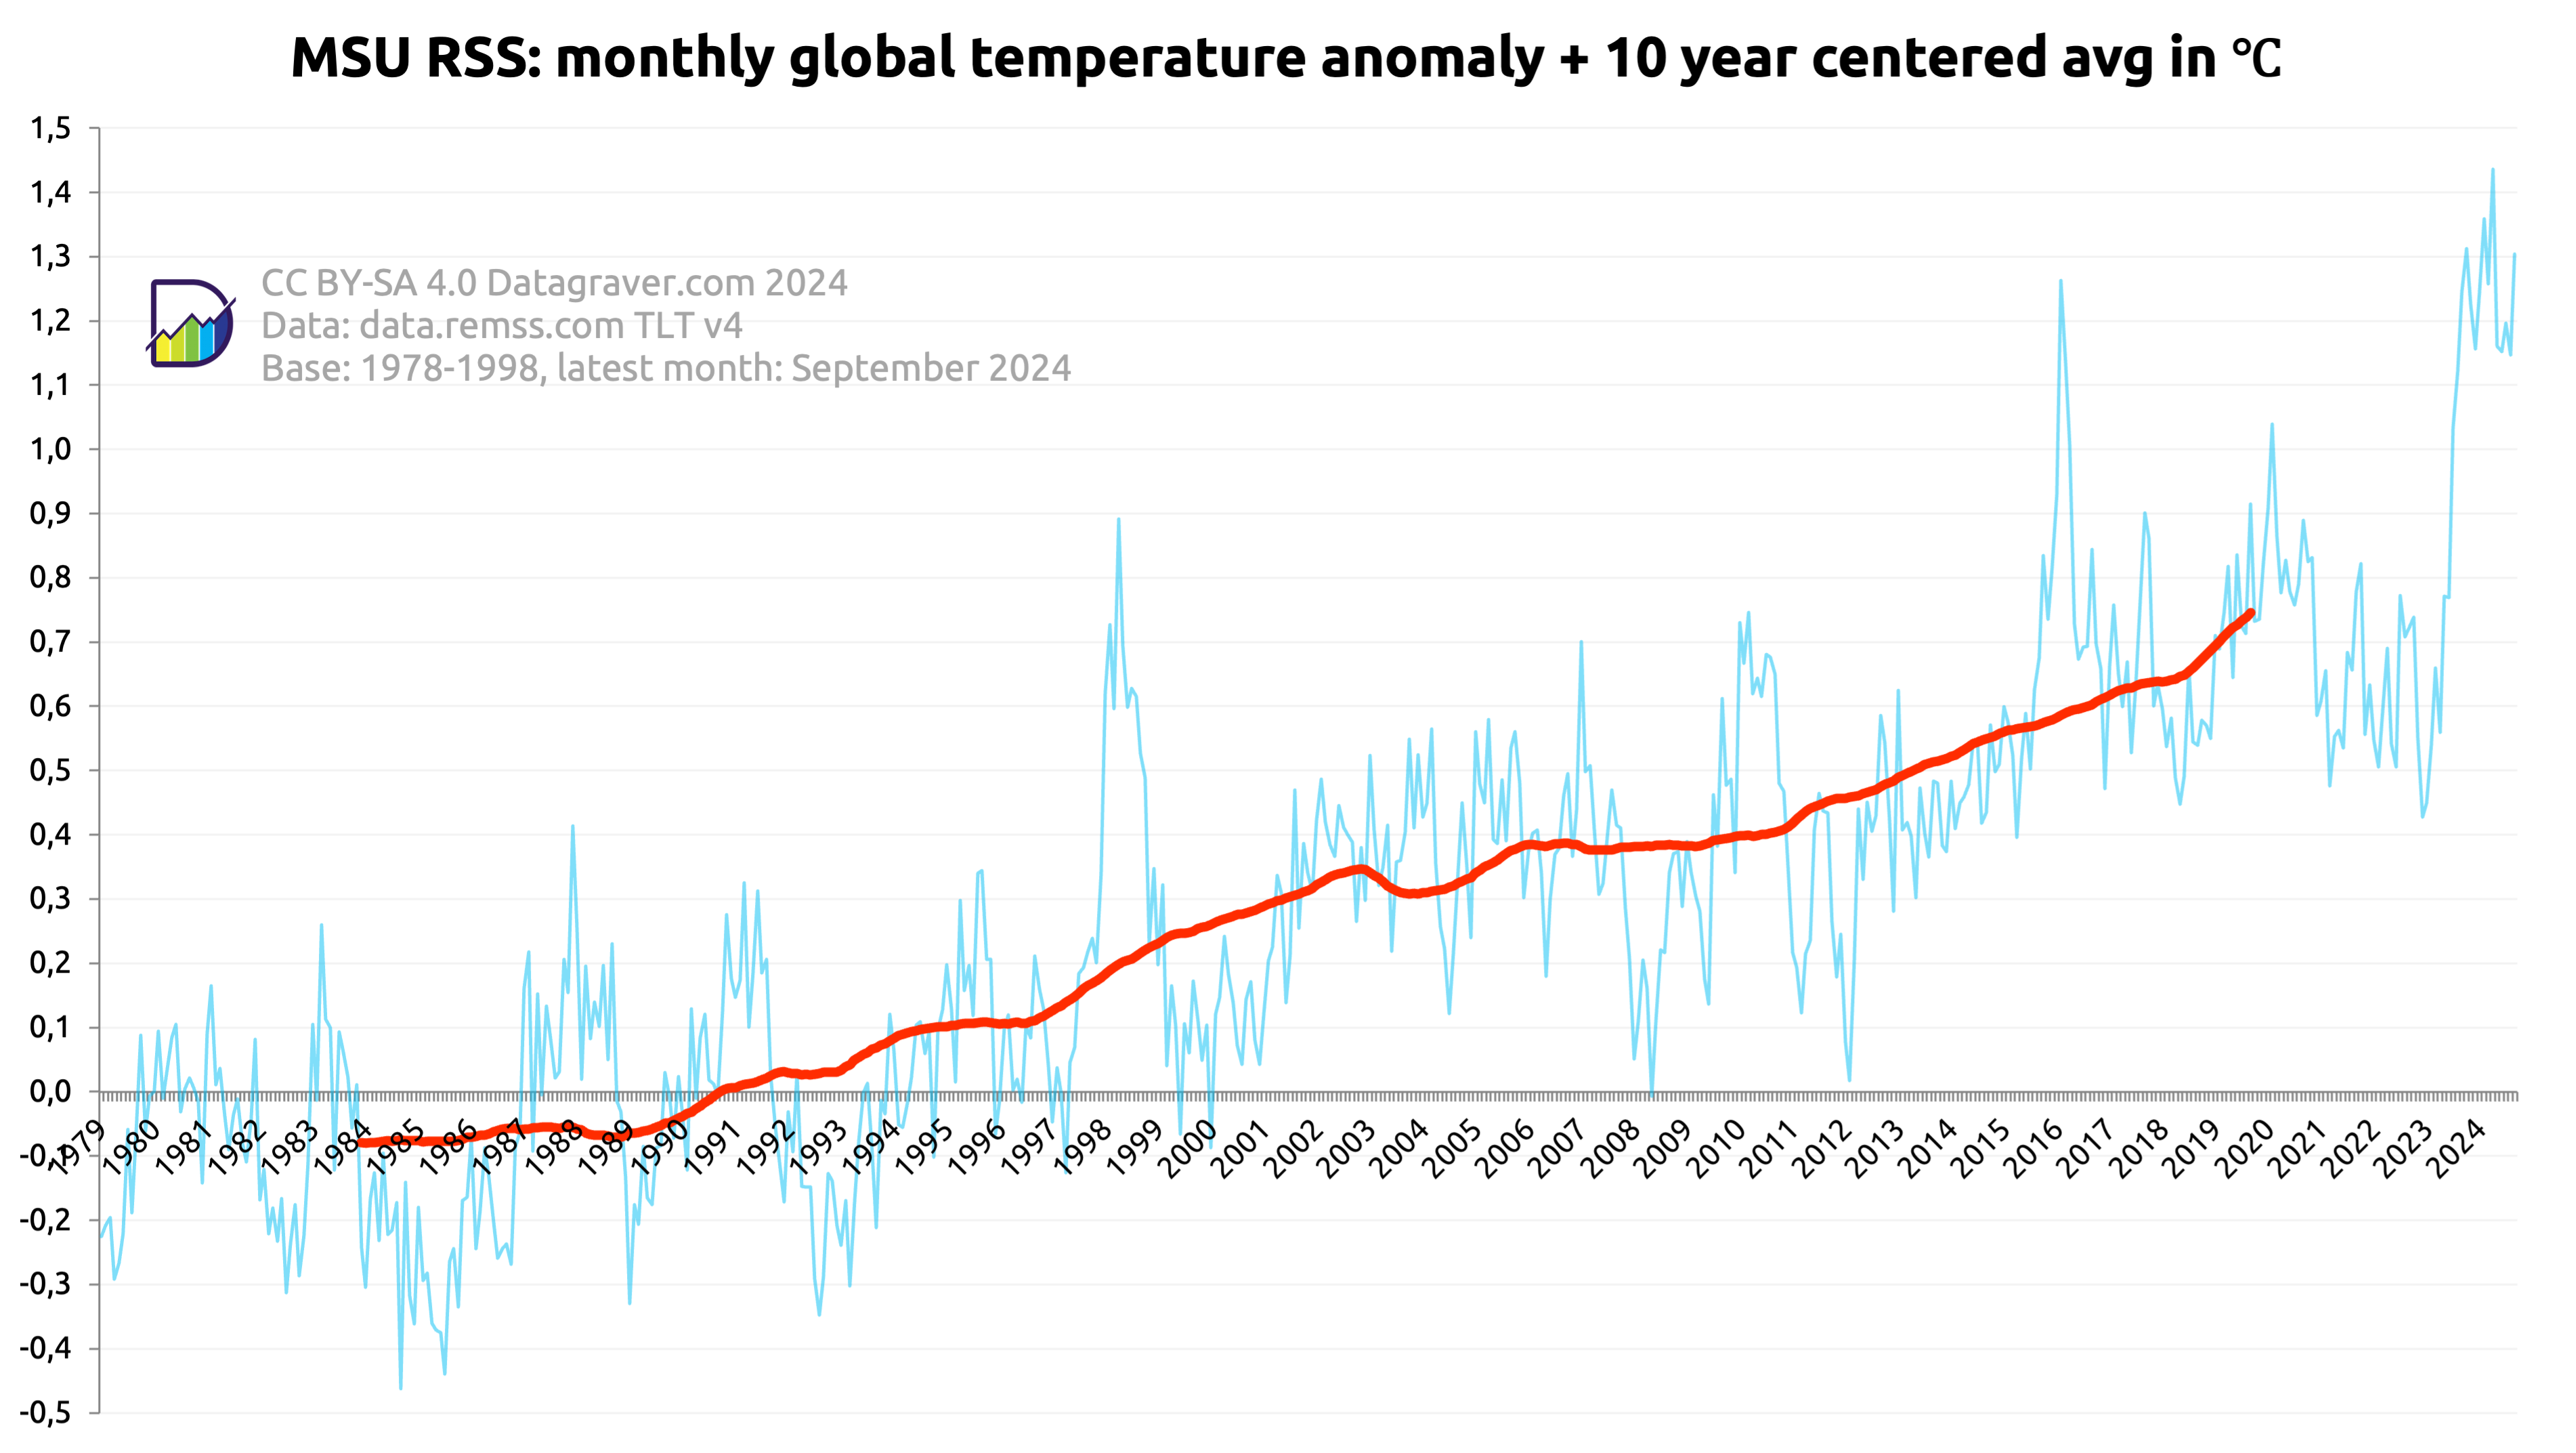
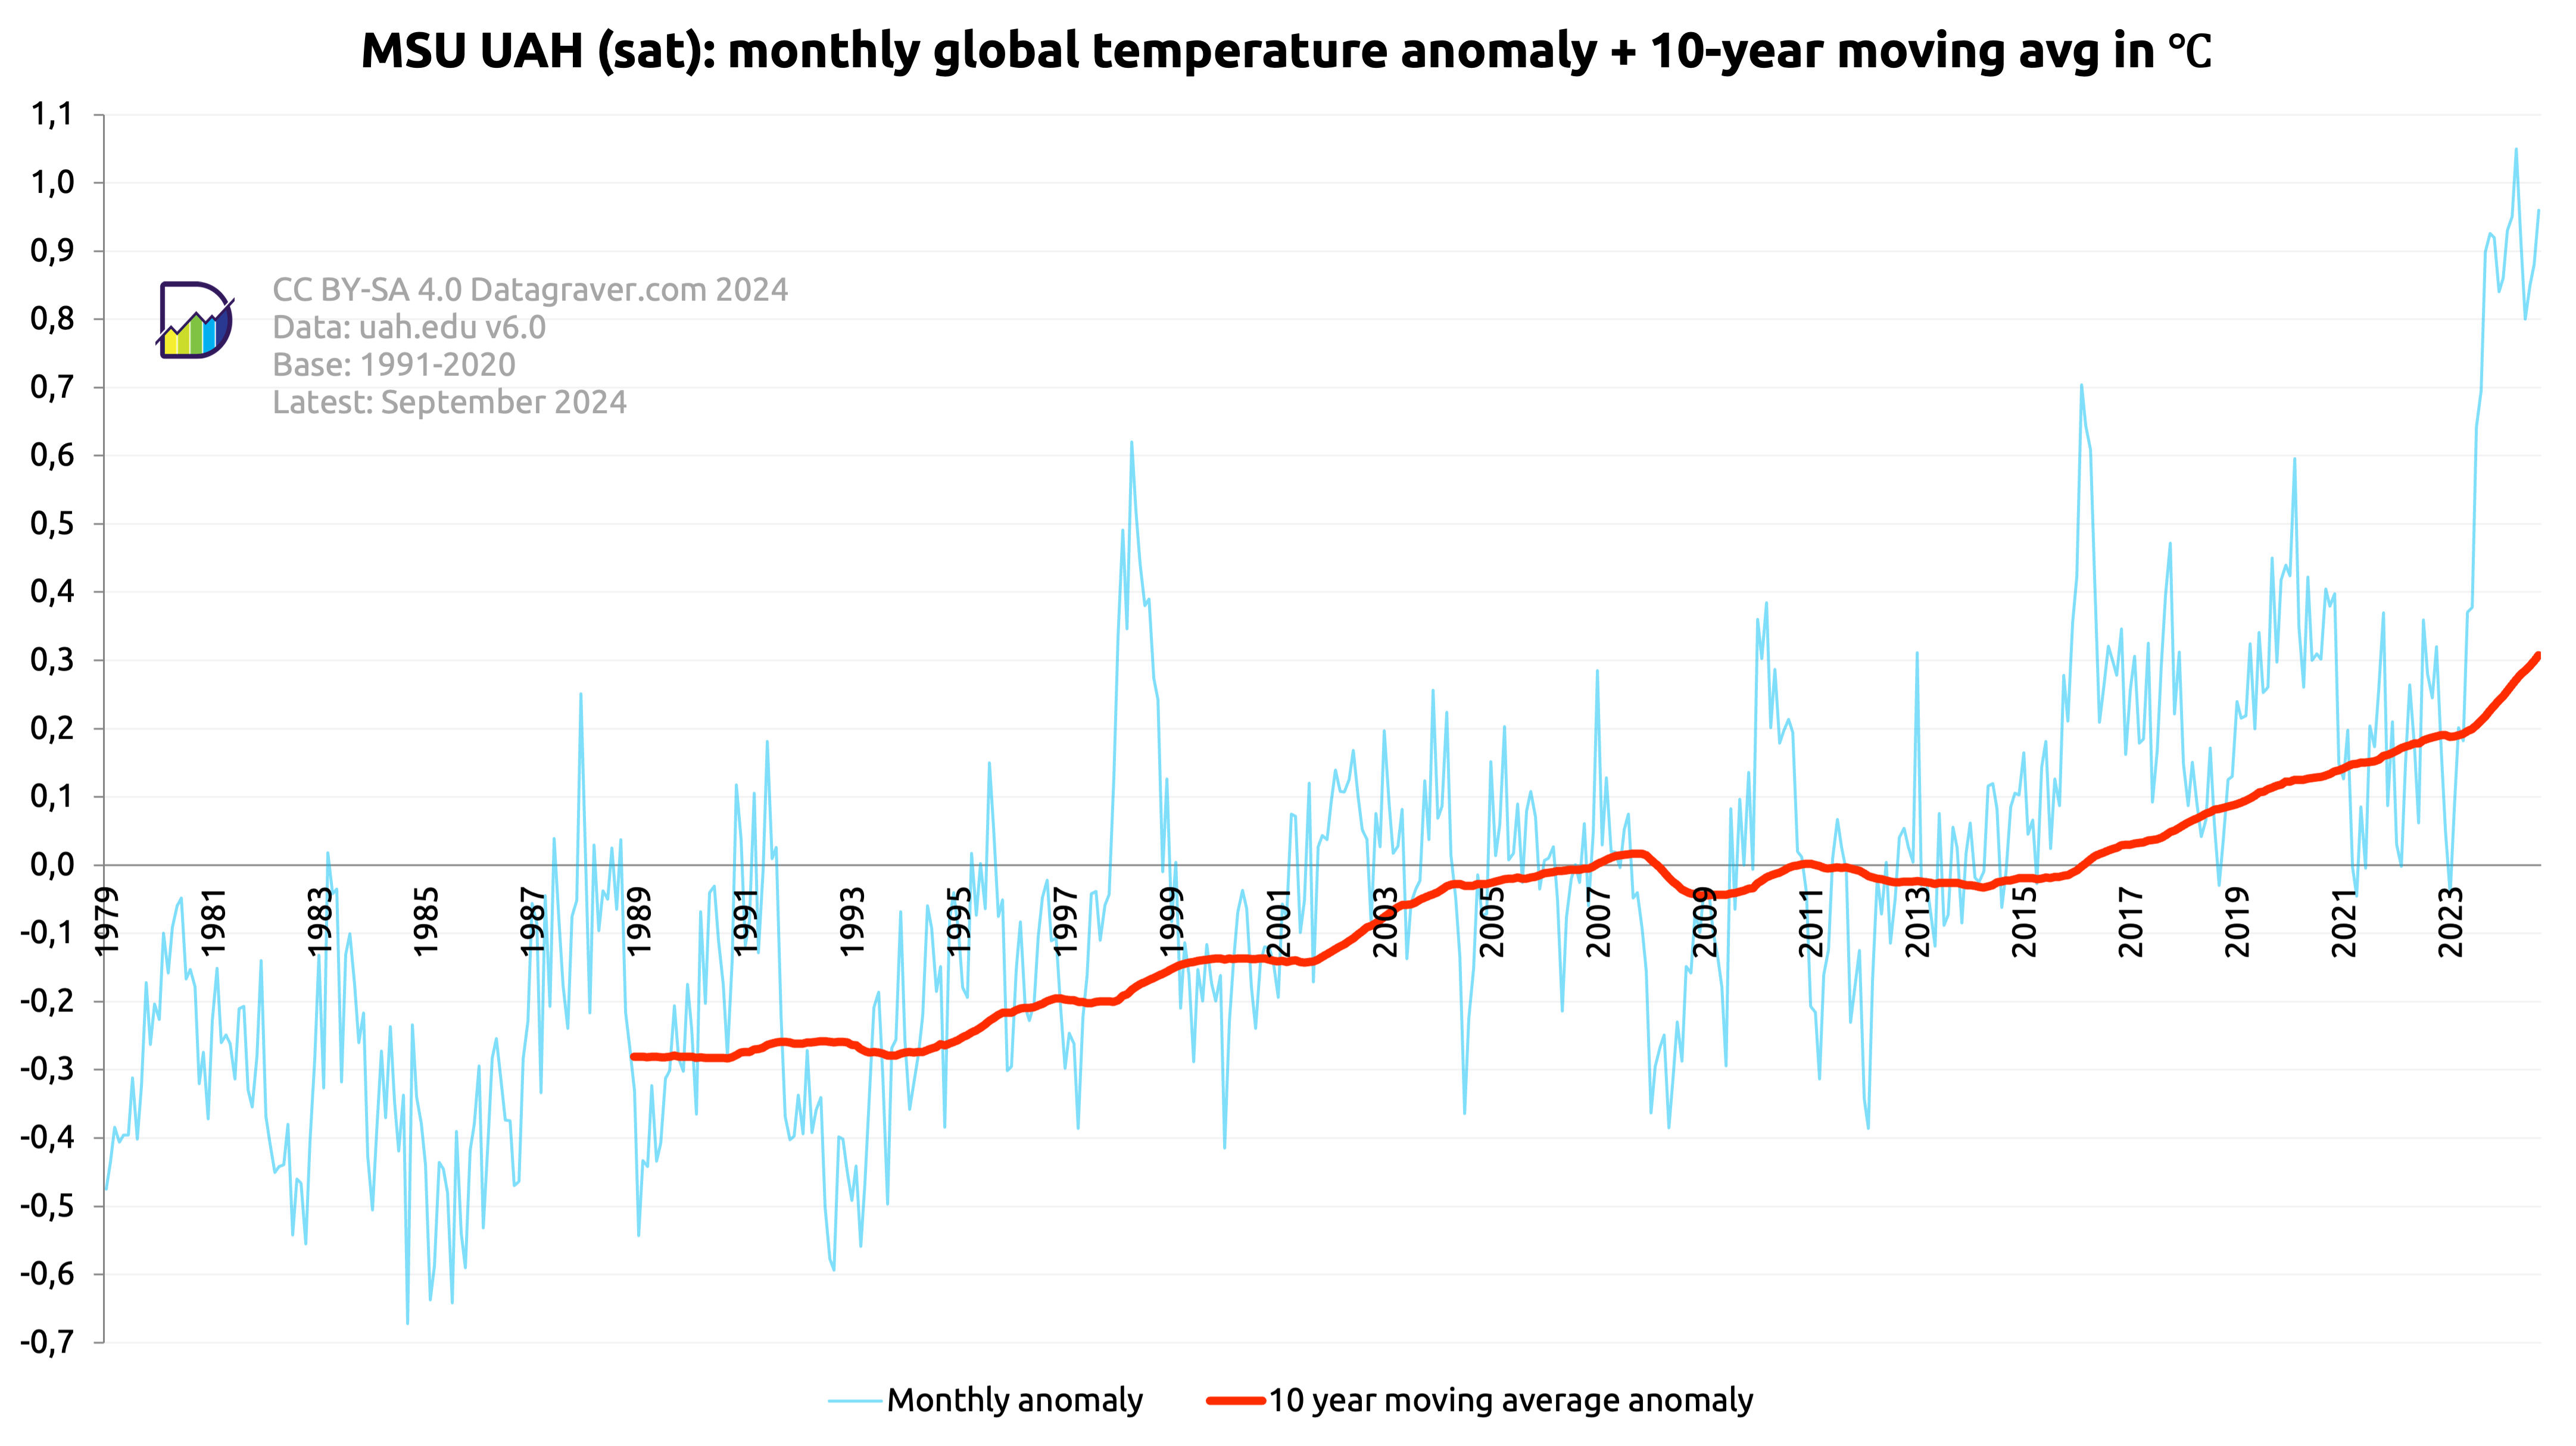
Here graphs based on the MSU UAH dataset (satellite) created by John Christy/Roy Spencer.
Regular updates. Check date in graph.
First graph is on the monthly anomalies plus a moving 10 year average.
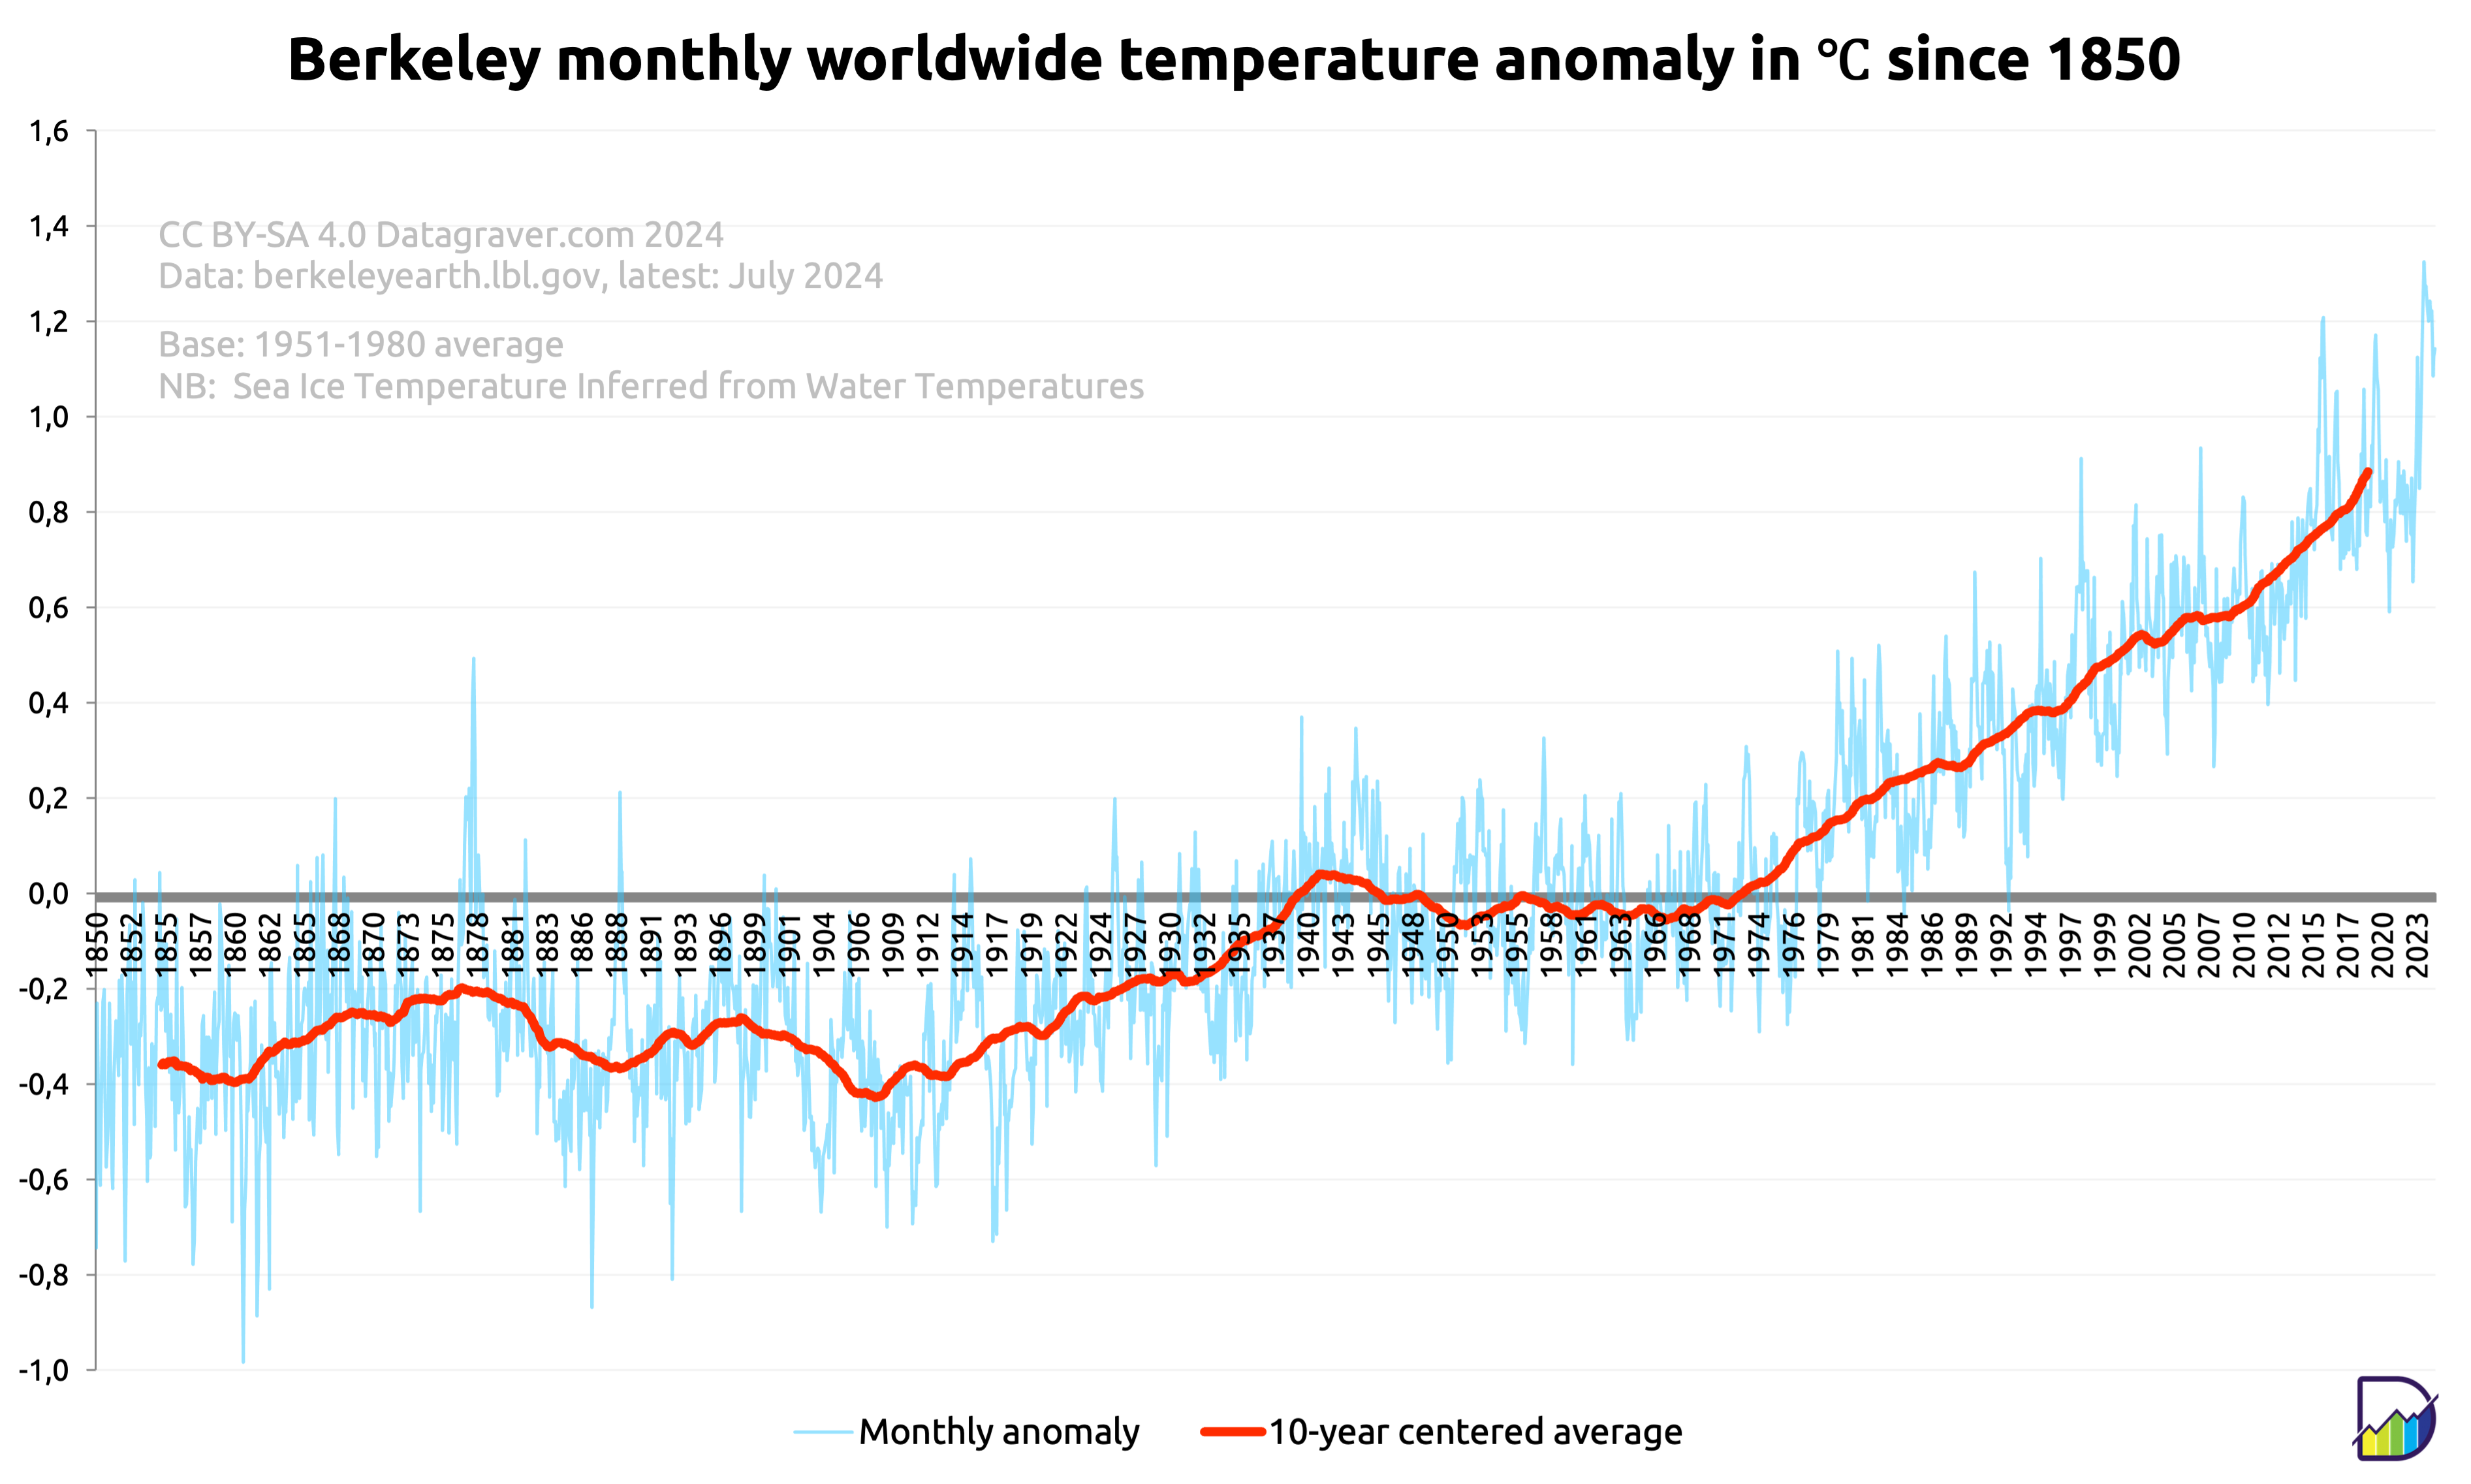
Here graphs based on the Berkeley dataset (reanalysis) created by Berkeley Earth .
Regular updates. Check date in graph.
First graph is on the monthly anomalies plus a centered 10 year average.
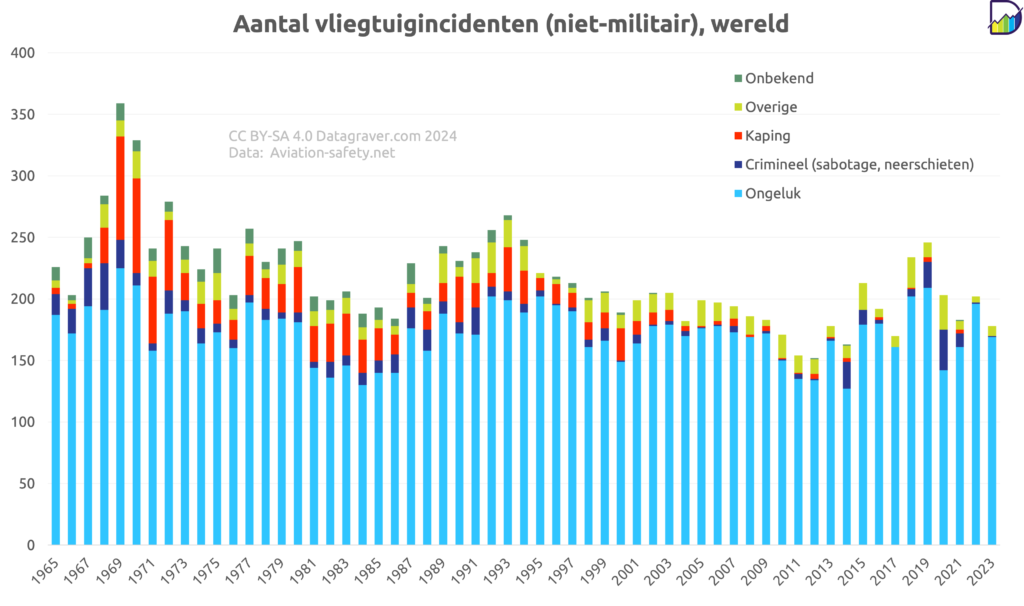
Overzicht vliegincidenten, exclusief militair, gehele wereld zoals verzameld door Aviation Safety Network.
Eerst aantal incidenten naar soort oorzaak.
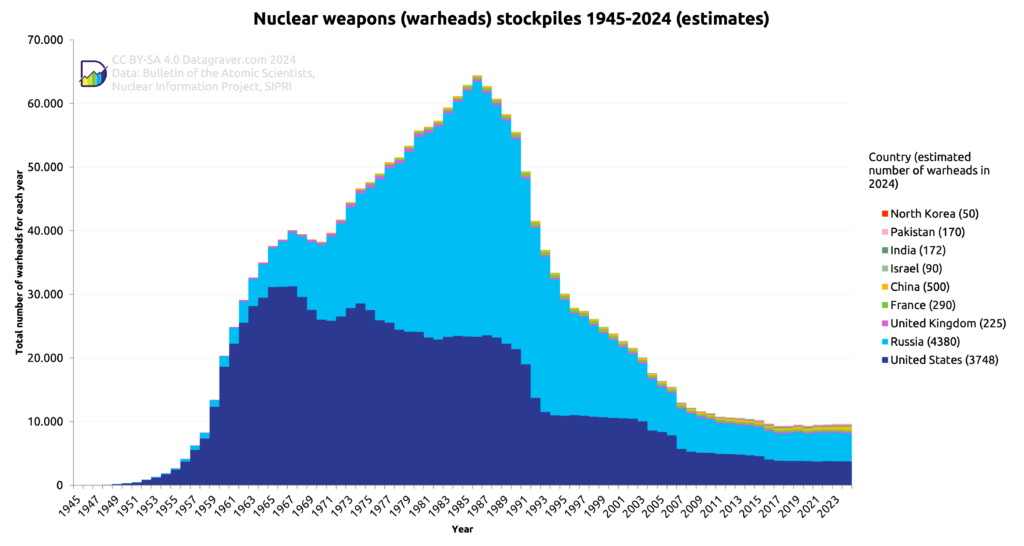
The estimated number of available (usable) nuclear warheads per country since 1945. Data available on data.world.
First as stacked bars to show the totals. Current count is behind country name.