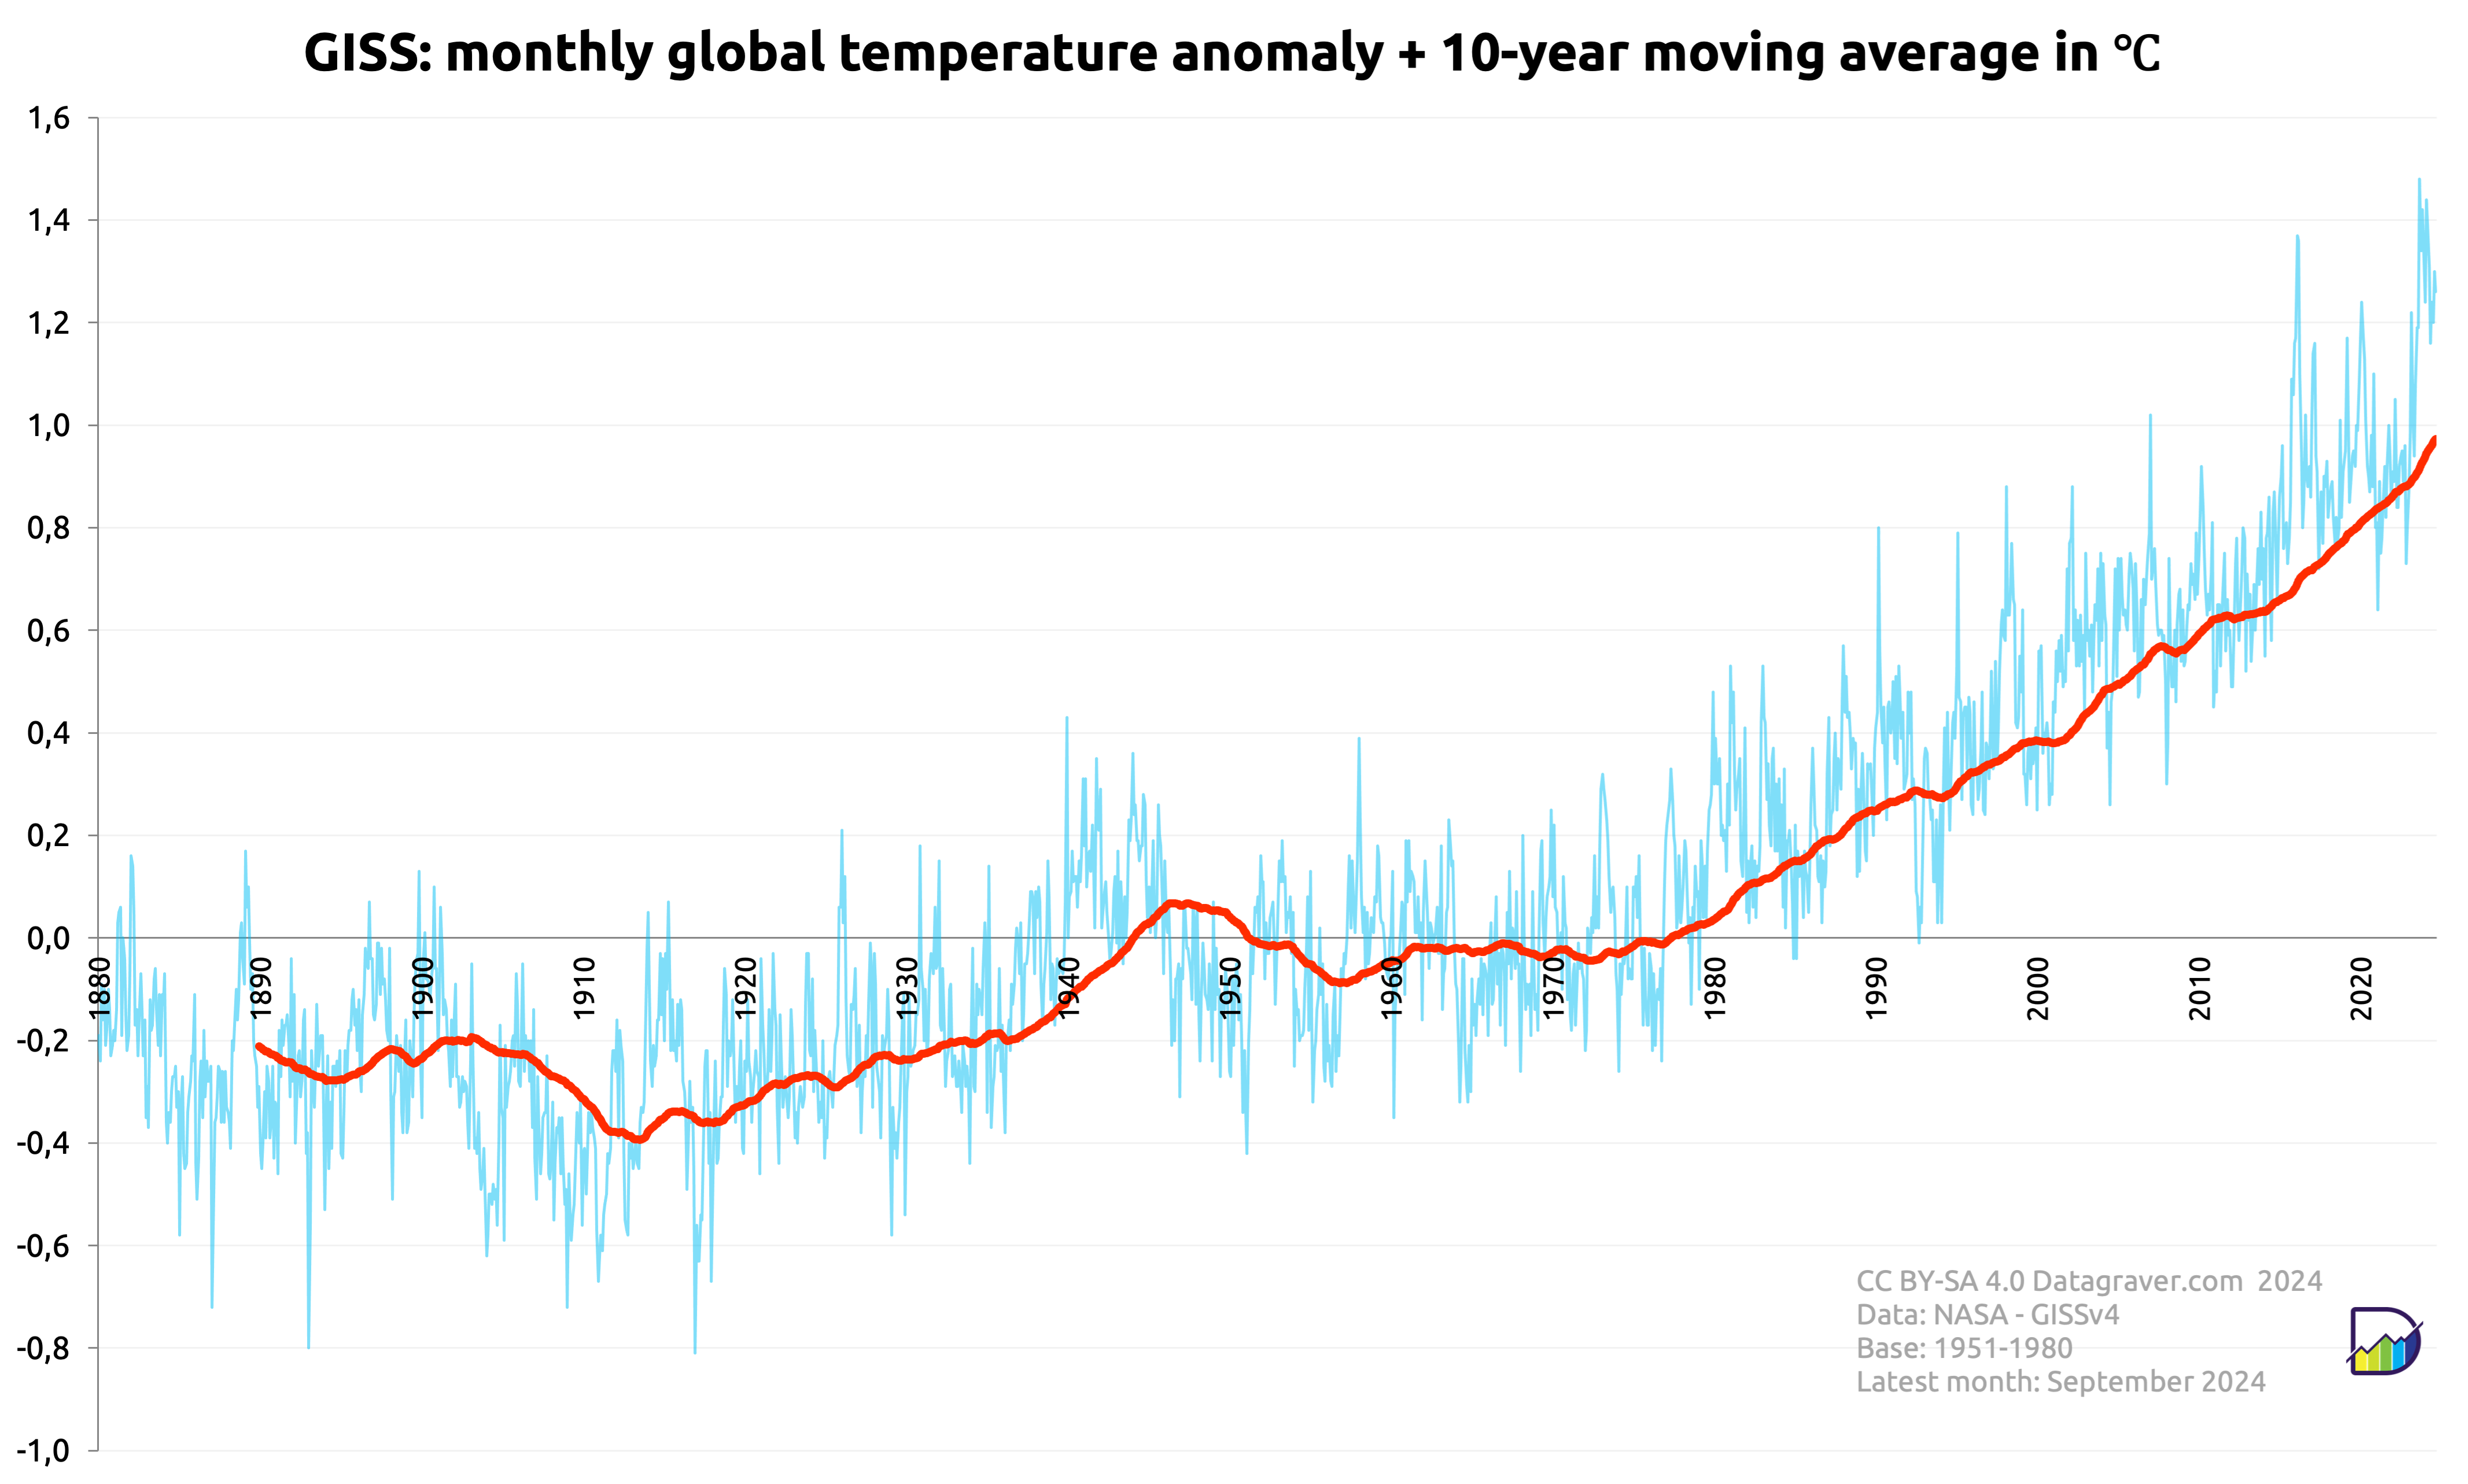
Here graphs based on the GISS dataset created by NASA.
Regular updates. Check date in graph.
First graph is on the monthly anomalies plus a 10 year average.
Then the yearly averages on the monthly anomalies.
Read moreDigging data
Here graphs based on the GISS dataset created by NASA.
Regular updates. Check date in graph.
First graph is on the monthly anomalies plus a 10 year average.
Then the yearly averages on the monthly anomalies.
Read moreSinds februari 2020 hebben we de nodige grafieken en tabellen gemaakt aangaande de ontwikkeling van Corona en gerelateerde zaken.
De meeste verschenen alleen op social media of werden gepubliceerd op onze vorige site. Een deel is alleen gebruikt binnen het RedTeam.
Omdat ze mogelijk nog relevant zijn voor nader onderzoek of publicaties, hebben we ze hier verzameld.
Let op, de meeste grafieken zijn maar tot op een bepaald moment up to date gehouden. Dat staat meestal vermeld in de grafiek zelf.
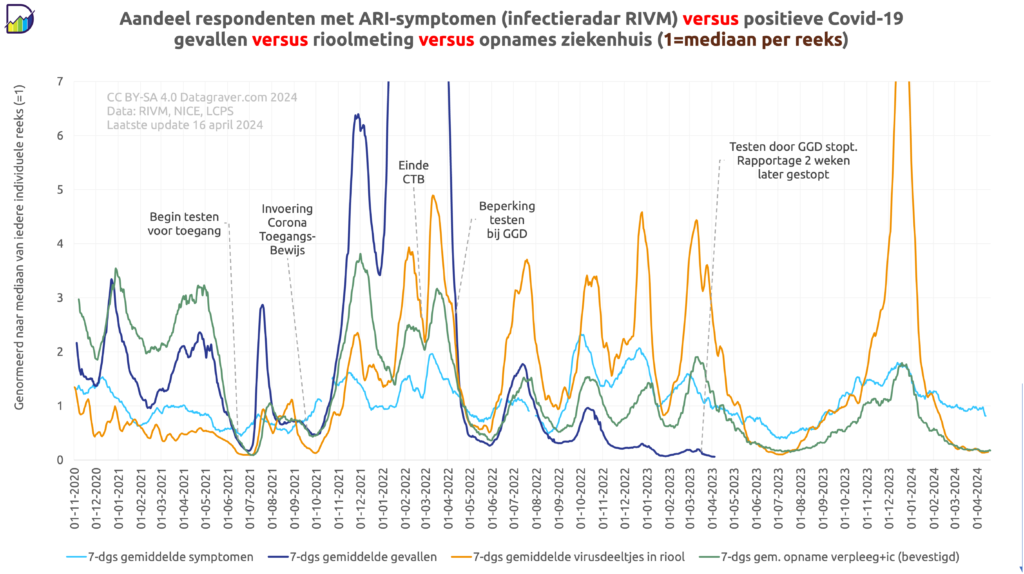
Eerst een recente grafiek. Hierin zitten vier indicatoren over het verloop van de Corona-pandemie. Alleen gaat het hier niet om absolute waarden maar om de waarde geschaald naar de mediaan van de reeks in de hele periode, wat gelijk staat aan 1 in deze grafiek.
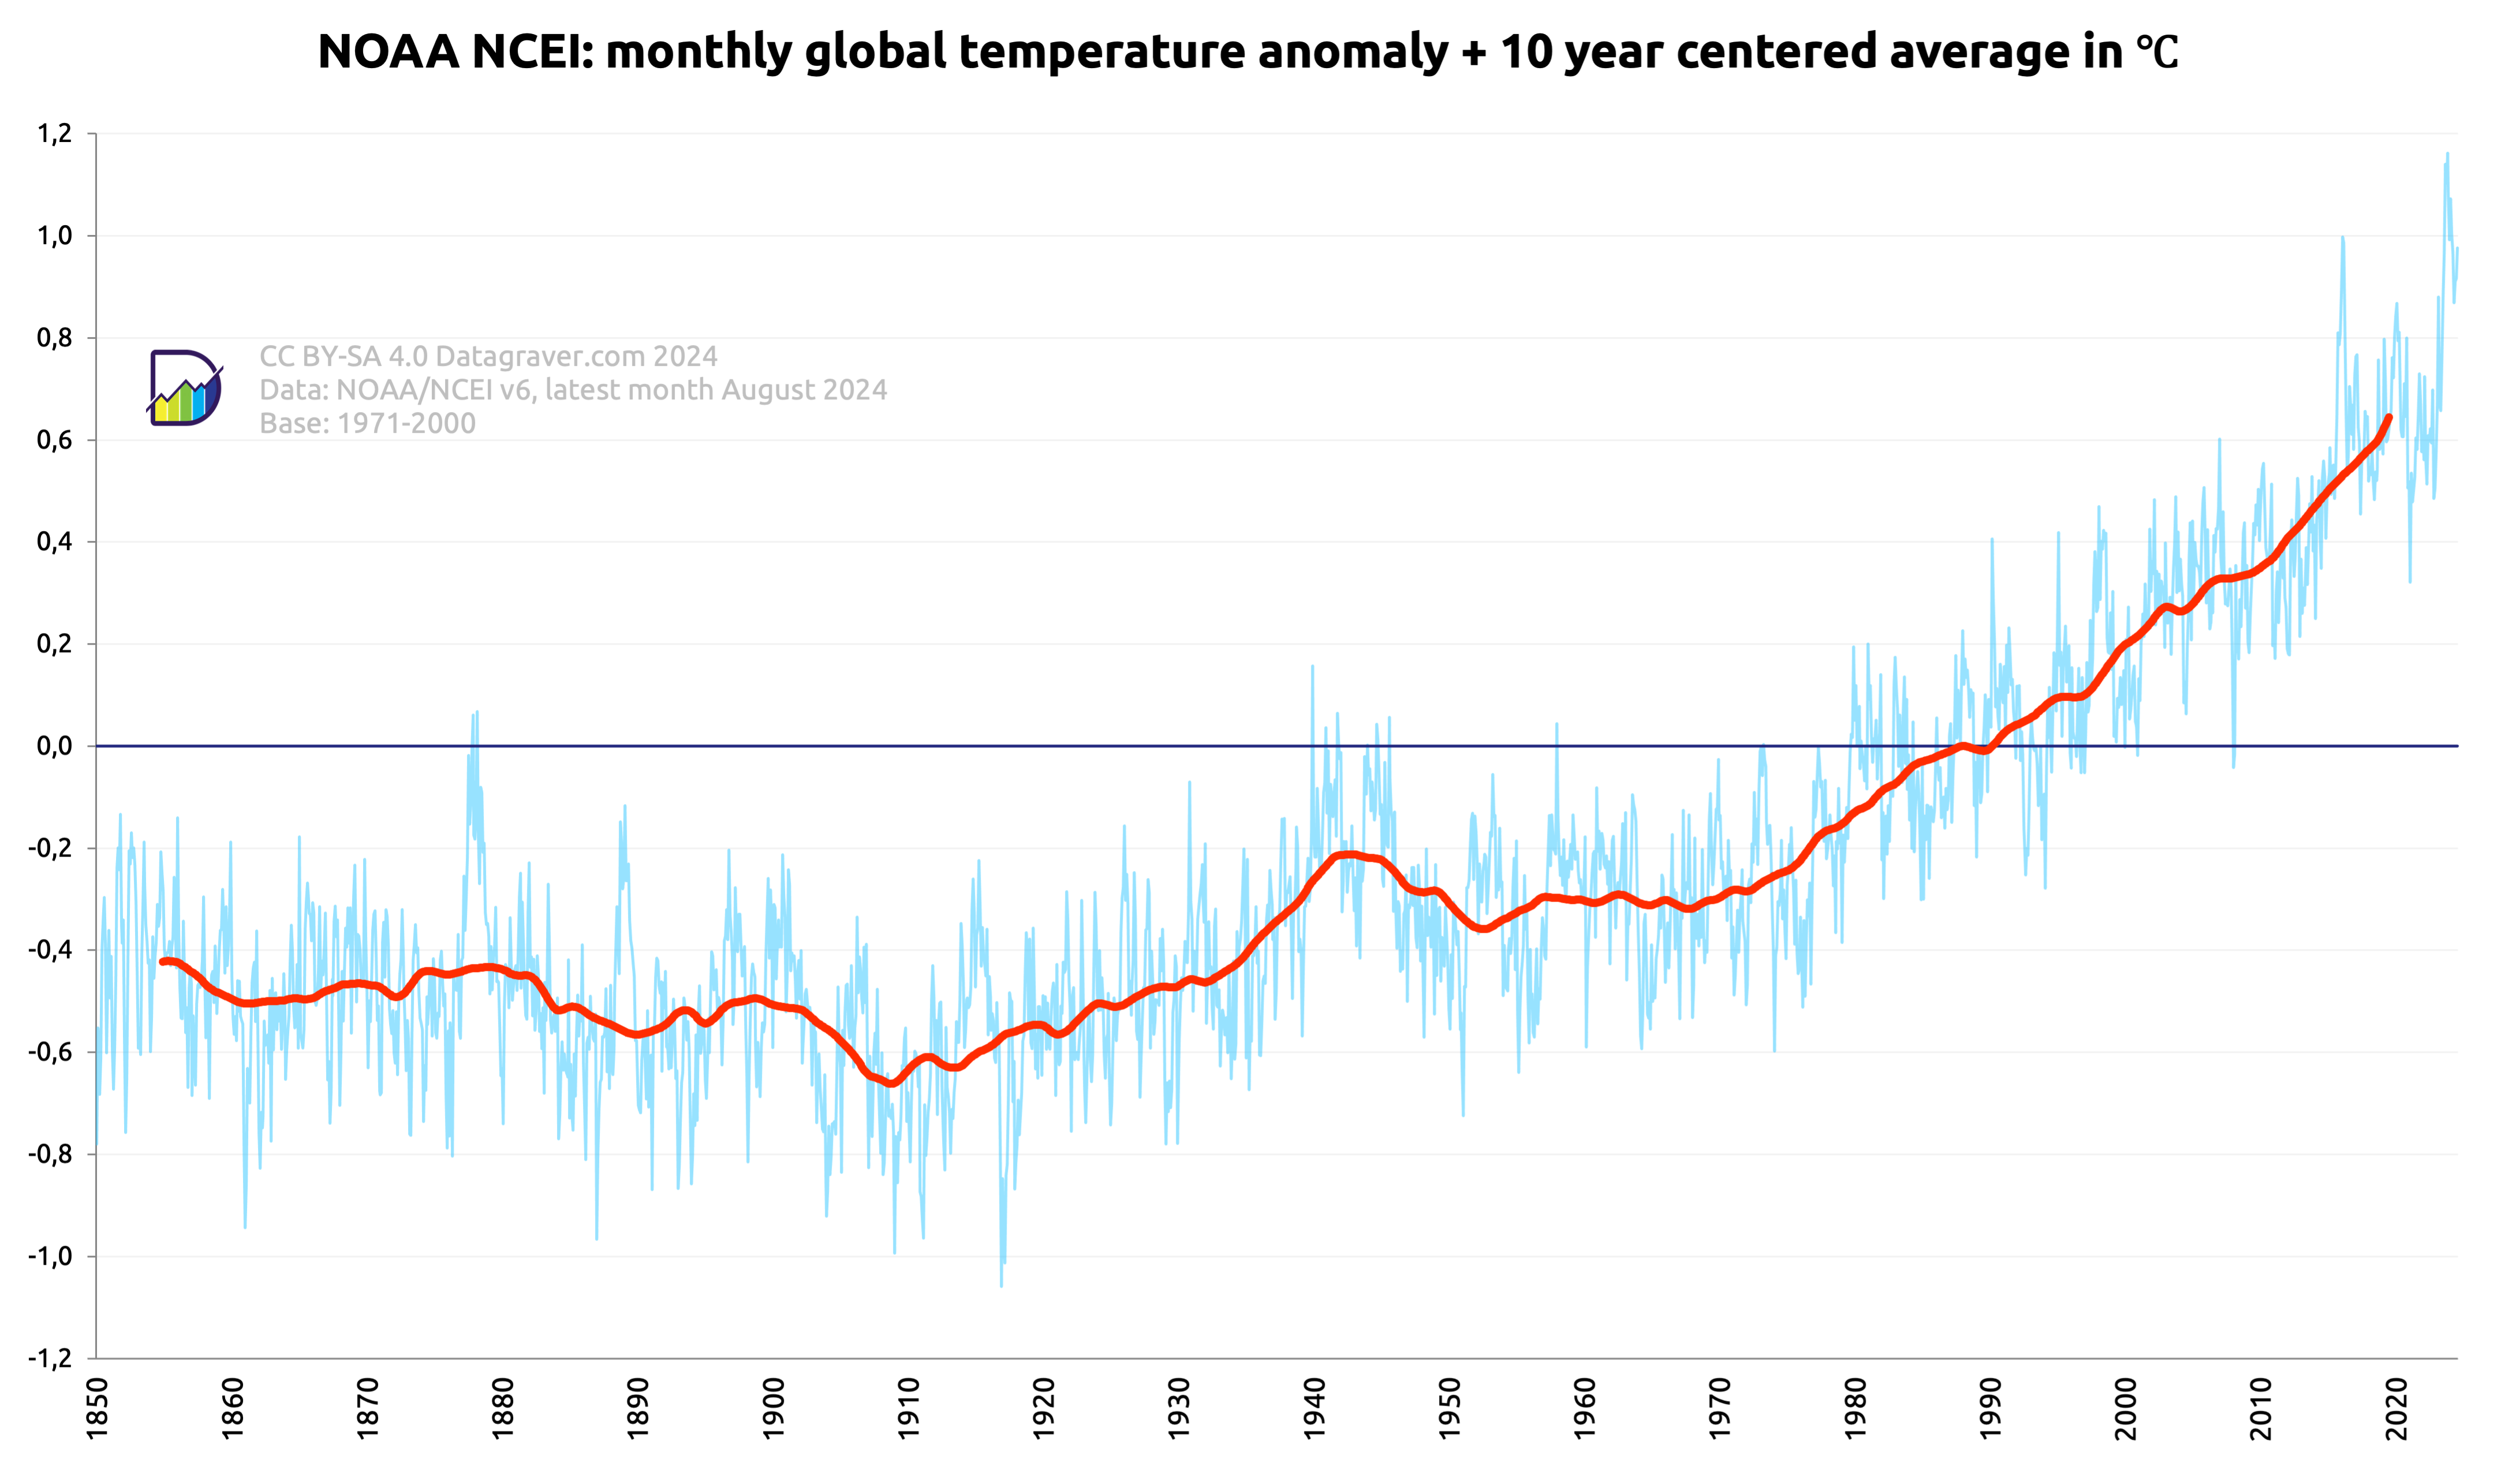
Here graphs based on the V6.0 NOAAGlobalTemp dataset created by NOAA/NCEI.
Regular updates. Check date in graph.
First graph is on the monthly anomalies plus a centered 10 year average.
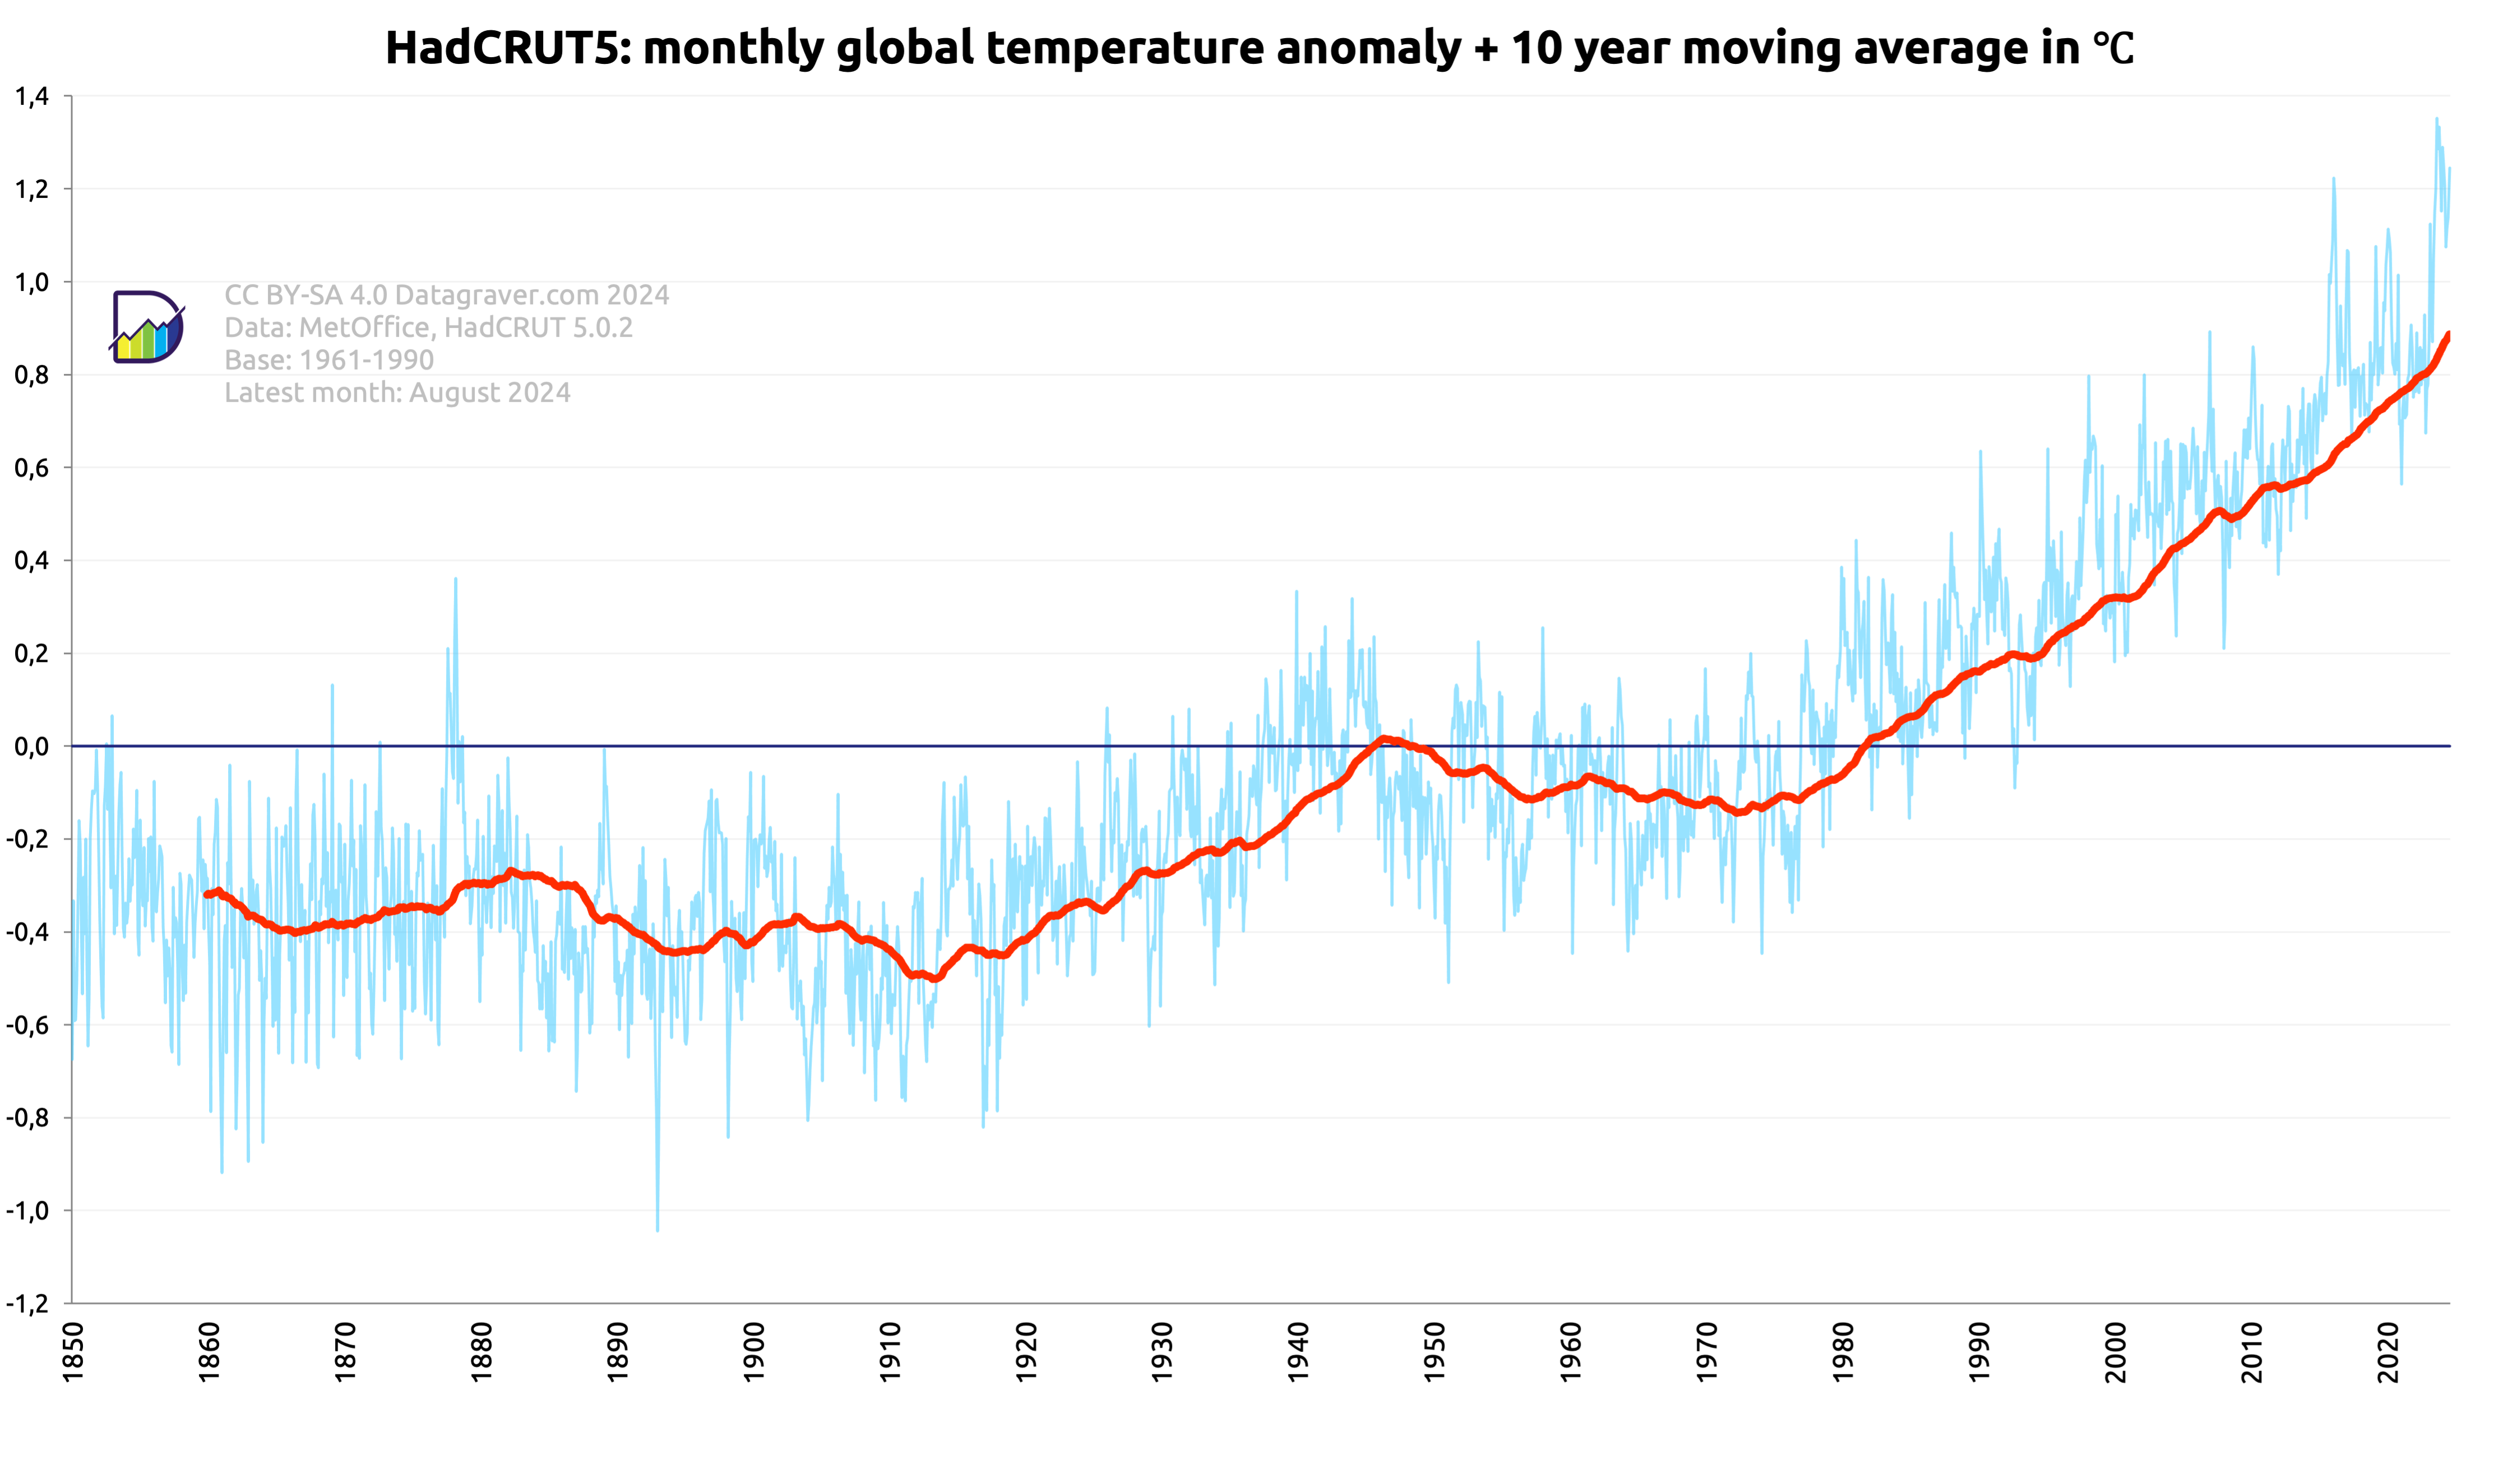
Here graphs based on the HadCRUT 5.0.2 dataset created by the Met Office (UK).
Regular updates. Check date in graph.
First graph is on the monthly anomalies plus a moving 10 year average.
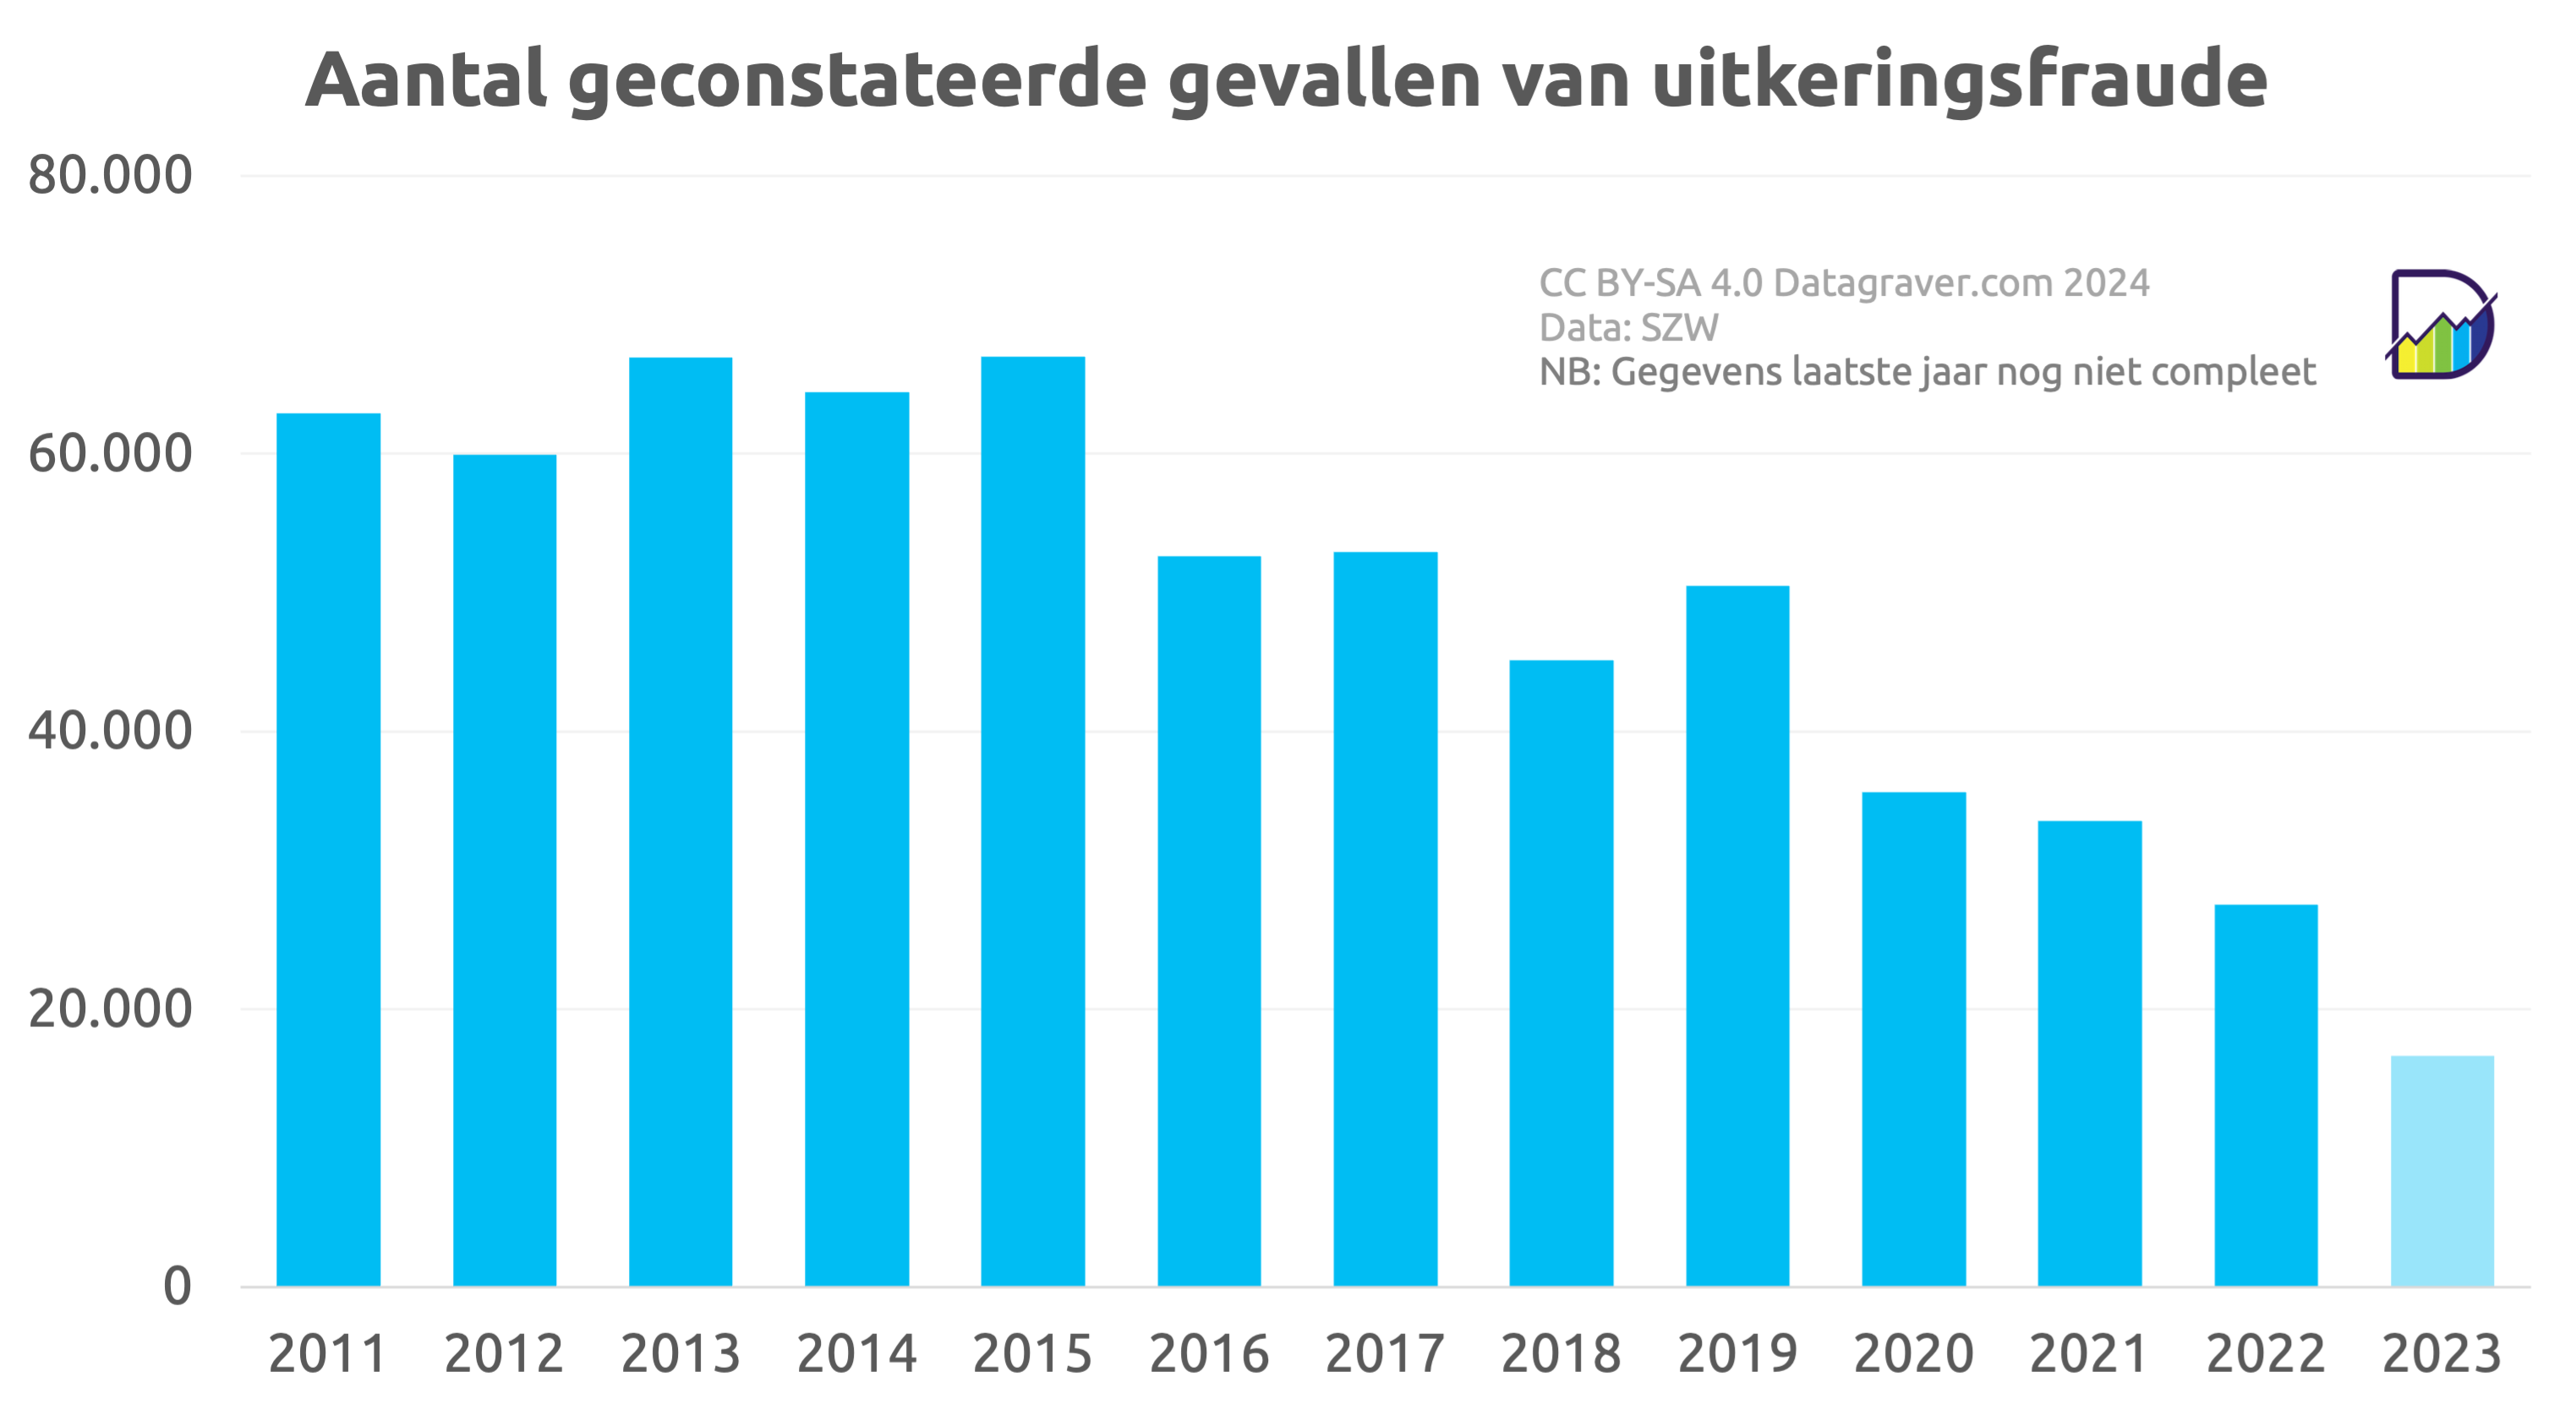
Het ministerie van SZW publiceert jaarlijks tijdens Prinsjesdag in haar stukken ook een overzicht van gevonden fraude op uitkeringen.
Aan de hand van die gegevens zijn onderstaande overzichten gemaakt.
NB: de gegevens van het laatst gemelde jaar zijn nog niet compleet. Rapportage over participatiewet loopt achter. Meestal zijn definitieve cijfers aantallen en totaal daarmee uiteindelijk 30% hoger.
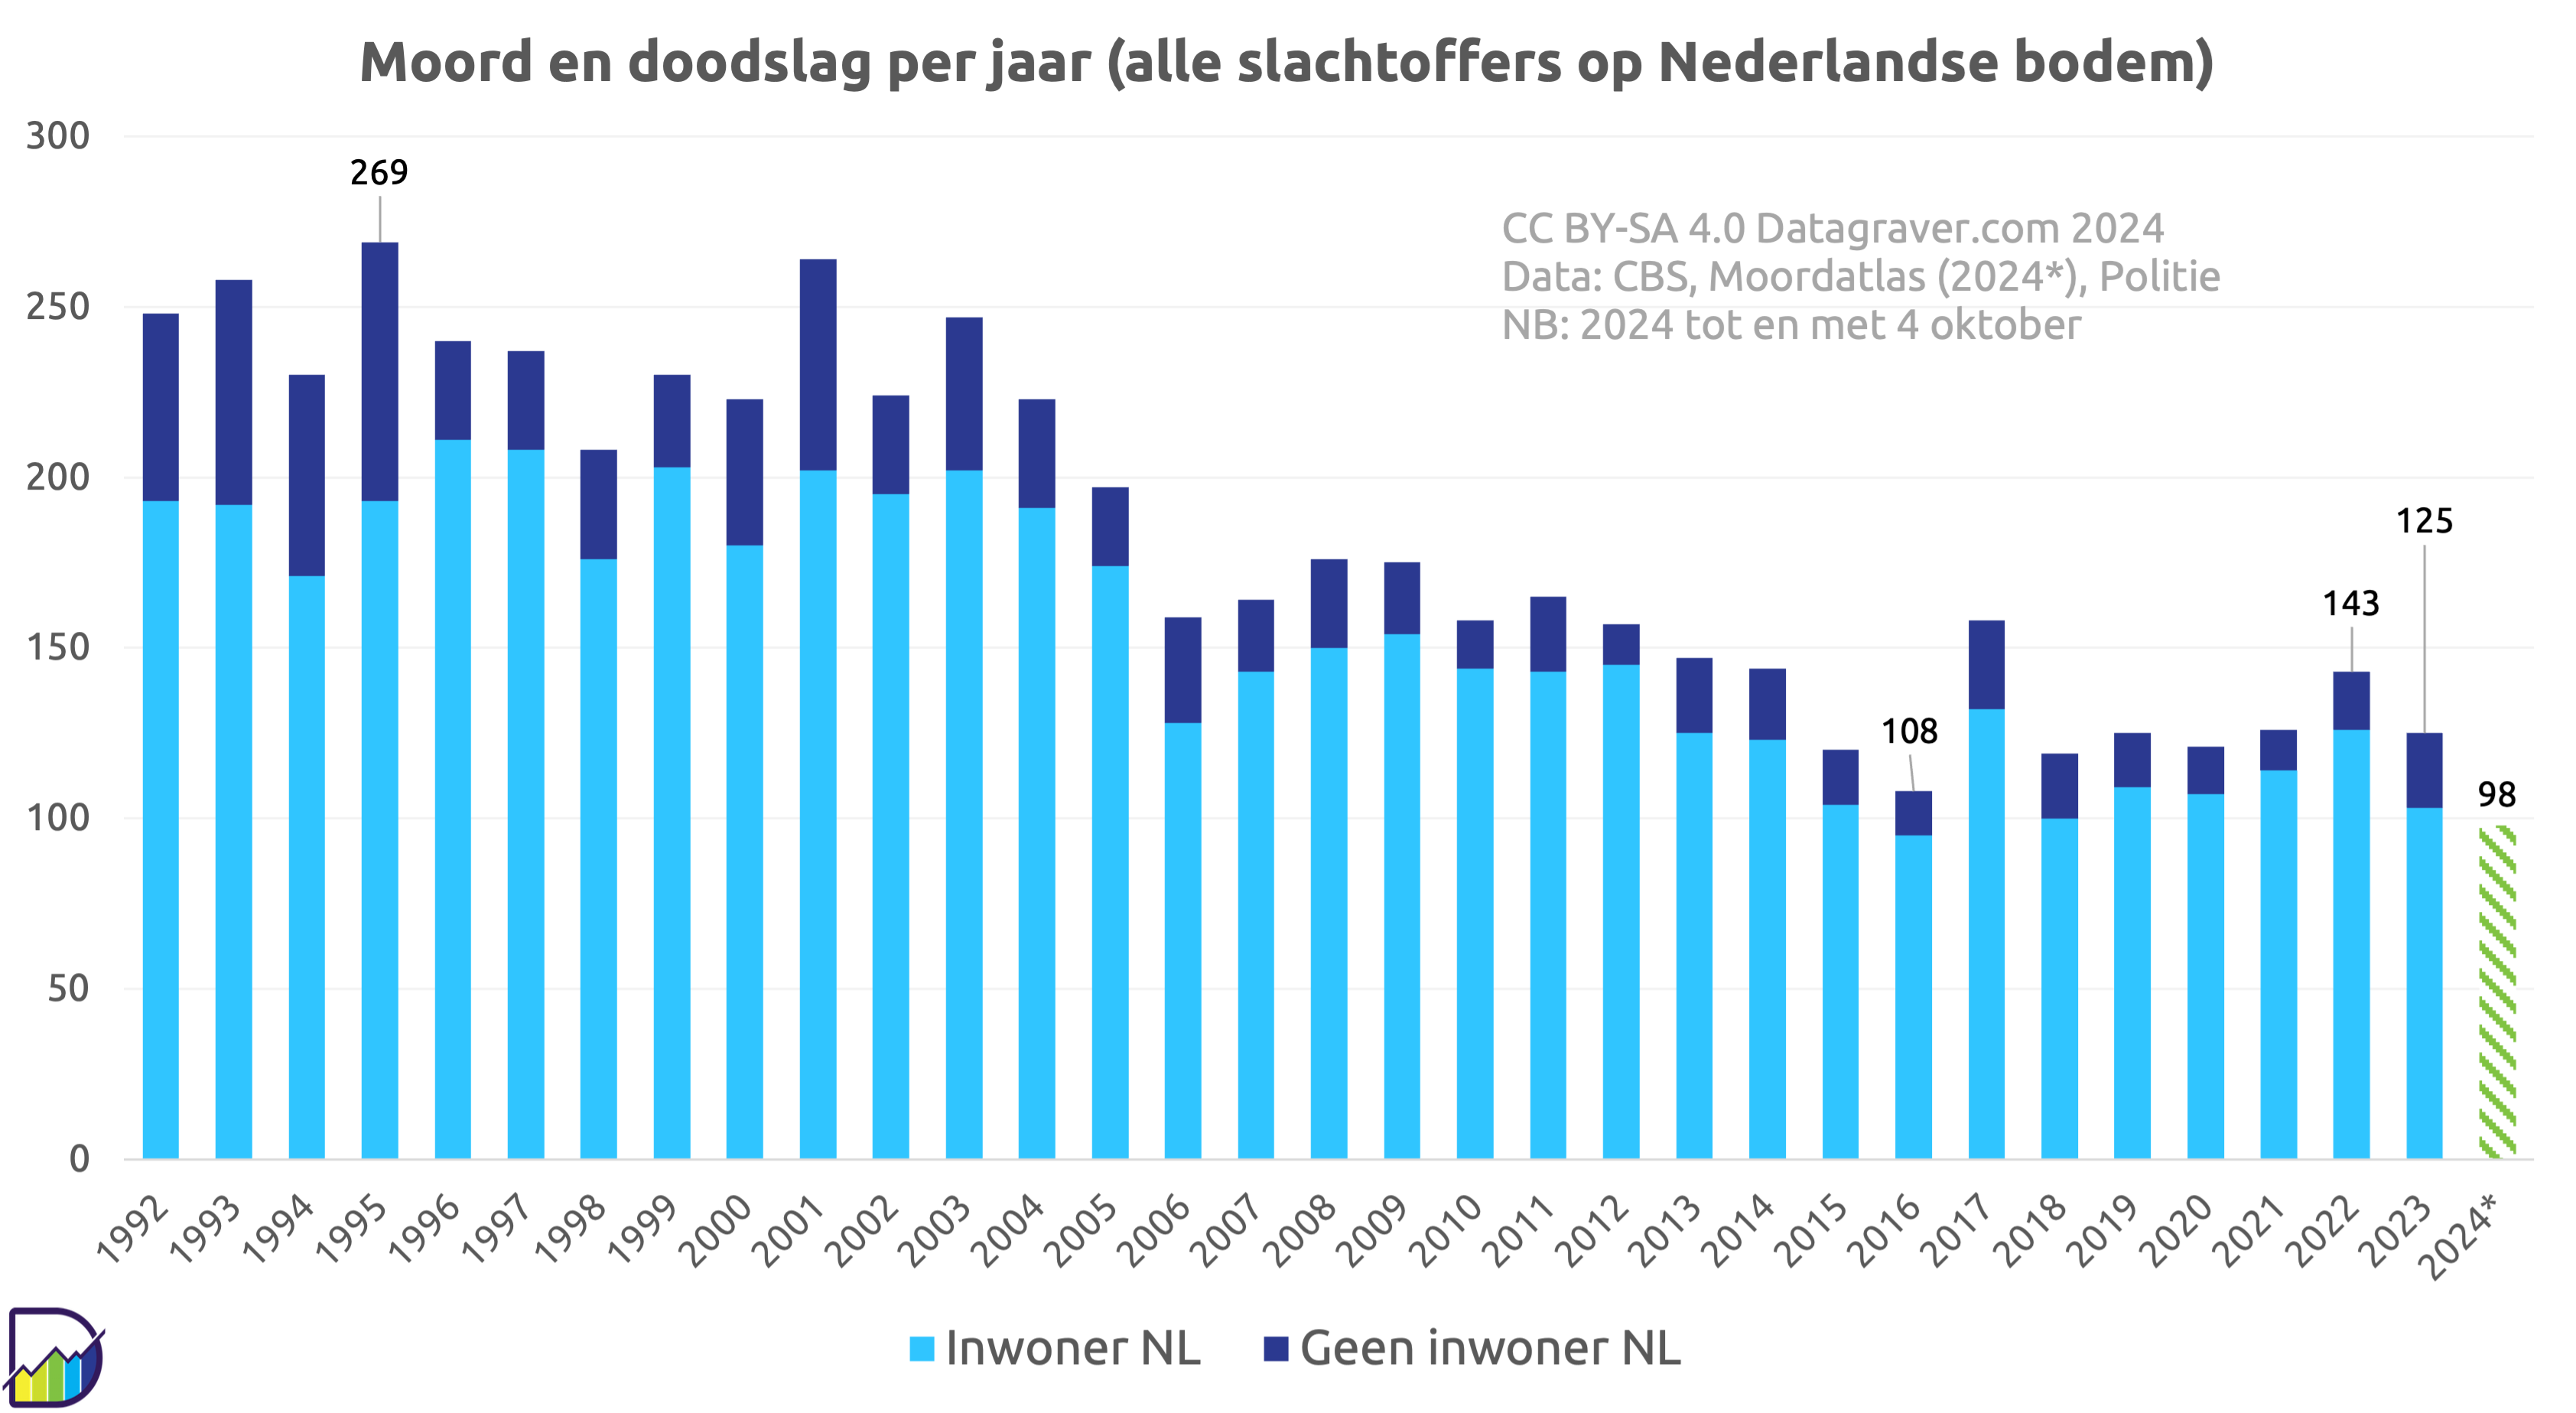
Cijfers moord en doodslag op Nederlandse bodem.
Eerst alle slachtoffers per jaar, plus de lopende telling voor het huidige jaar.
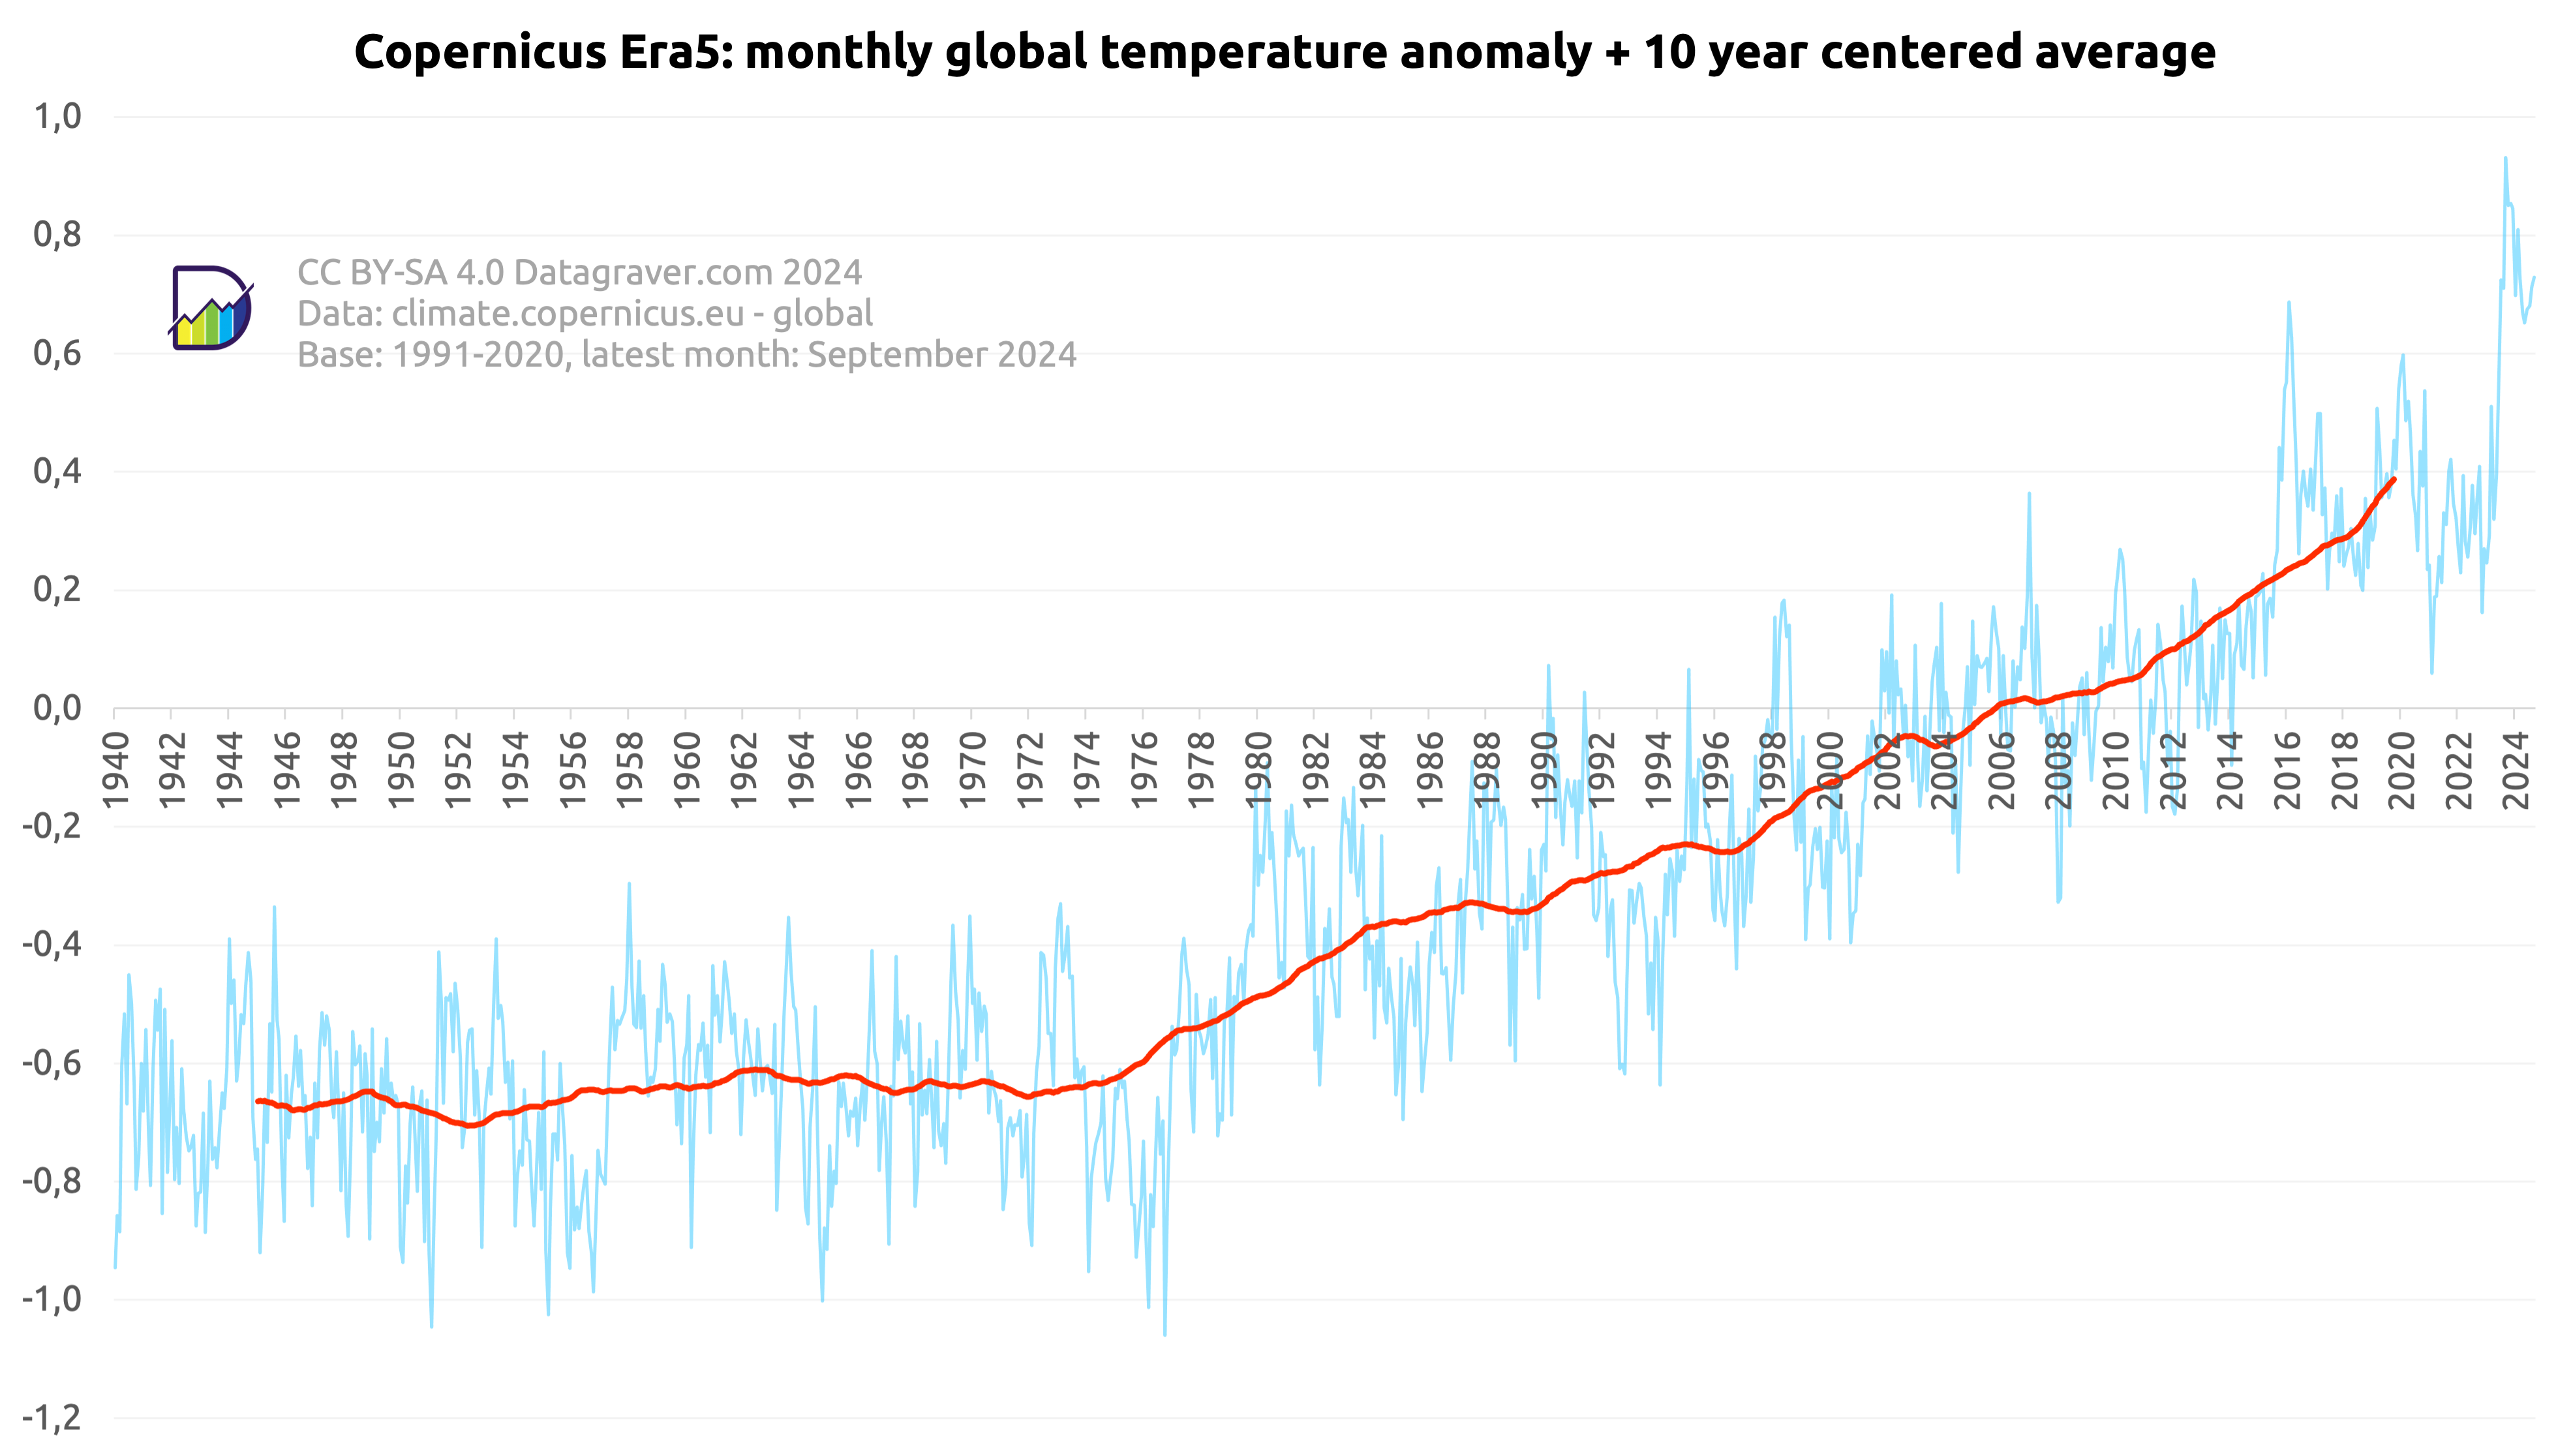
Here graphs based on the climate data set created by Copernicus Programme as implemented by ECMWF, supplemented with the data from 1940 to 1978.
Regular updates. Check date in graph.
First graph is on the monthly anomalies plus a 10 year centered average.