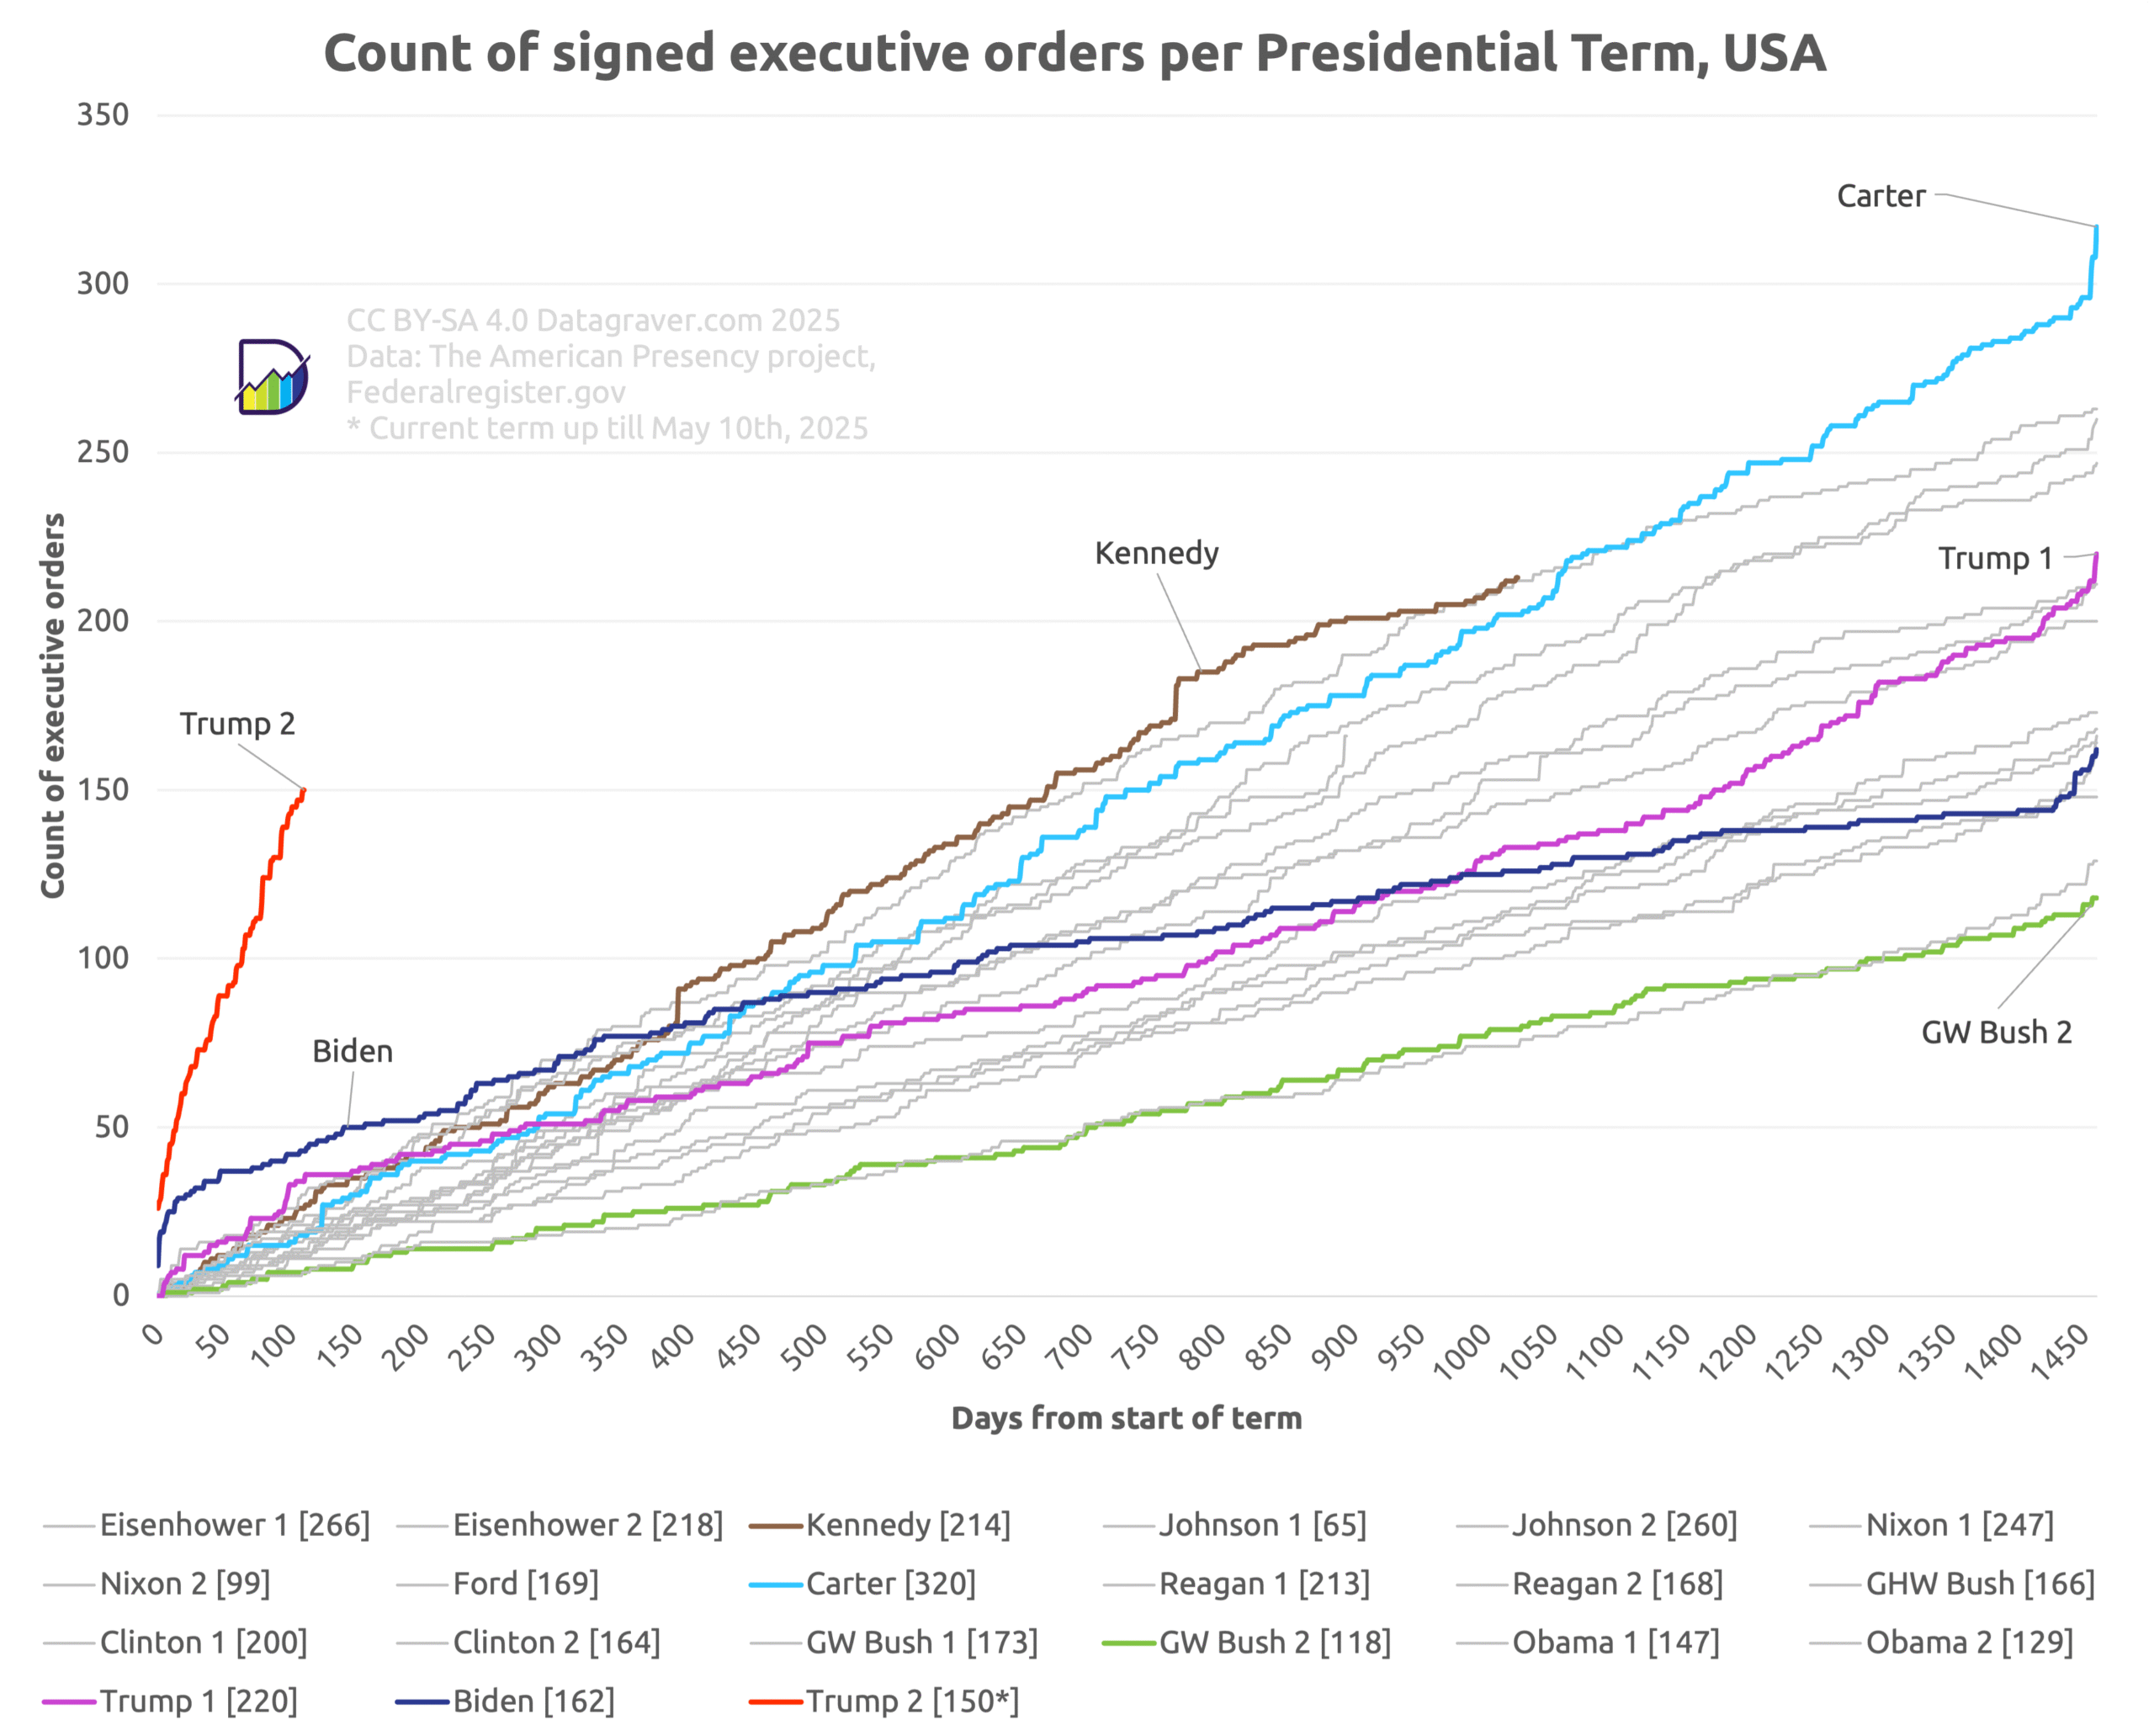
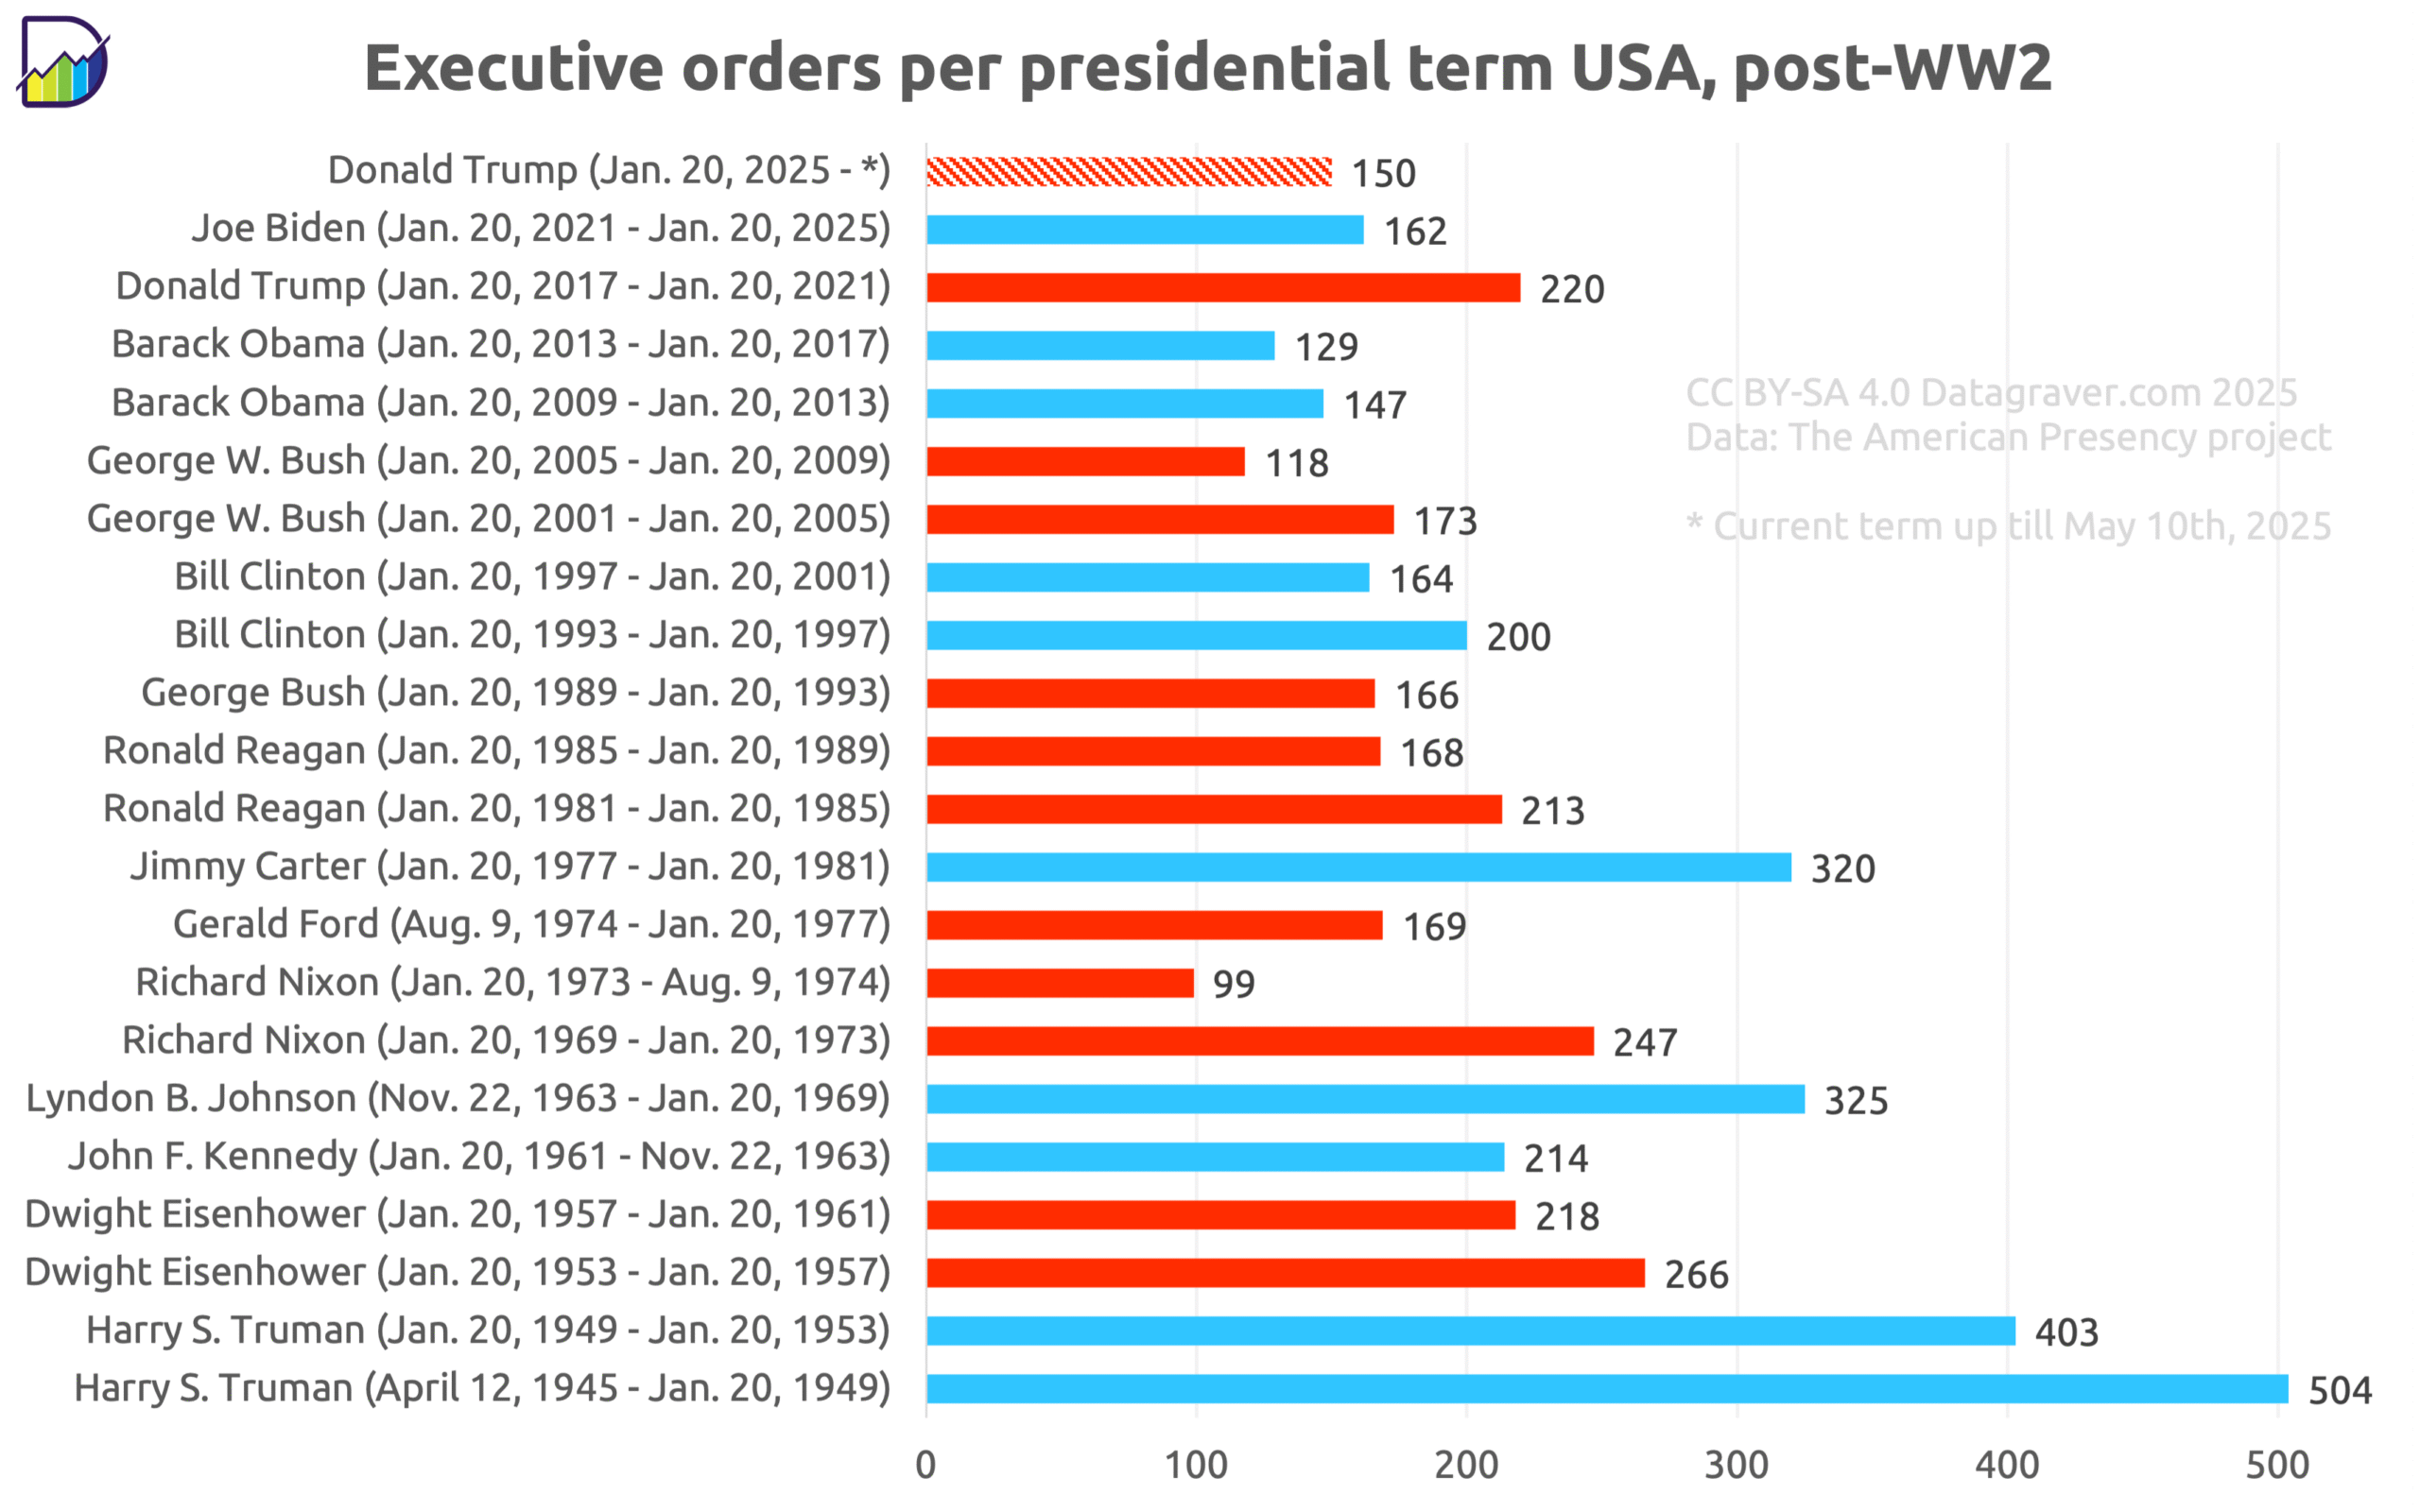
Using data from The American Presidency Project and the Federal Register two graphs on the number of executive orders per presidential term in the USA, post WWII.
First one shows the count per term per day since the start of the term. This means some lines stop earlier than others because they either concern not finishing the term (Kennedy, Nixon) or vice-presidents taking over the presidency (Johnson, Ford).
Truman has been excluded in this overview to make it readable.

Second graph shows totals per presidential term, this time with Truman included.
For Trump 2 up till date of publication (no full term).
