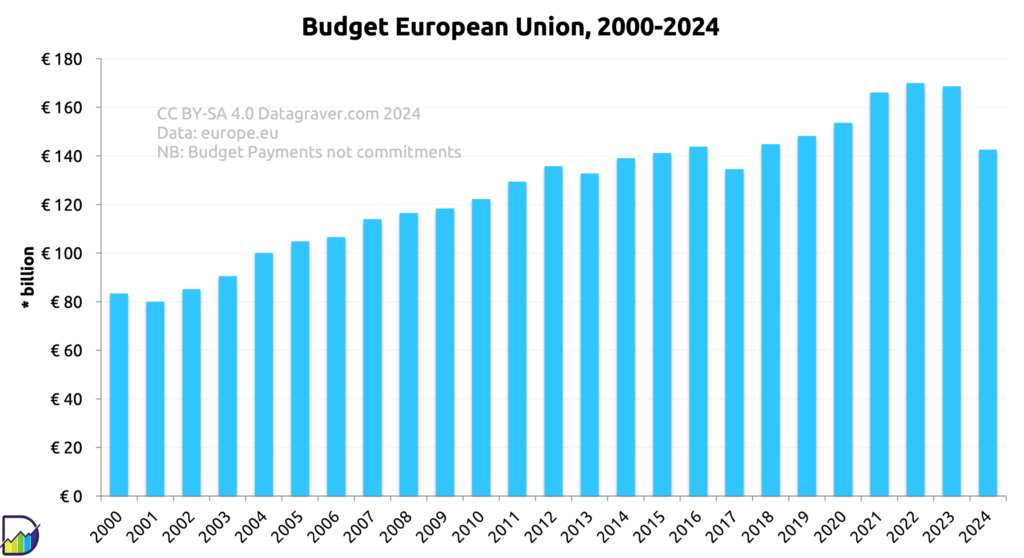
Overview of the EU budget for each year from 2000 onward. This concerns the Payments part of the budget.
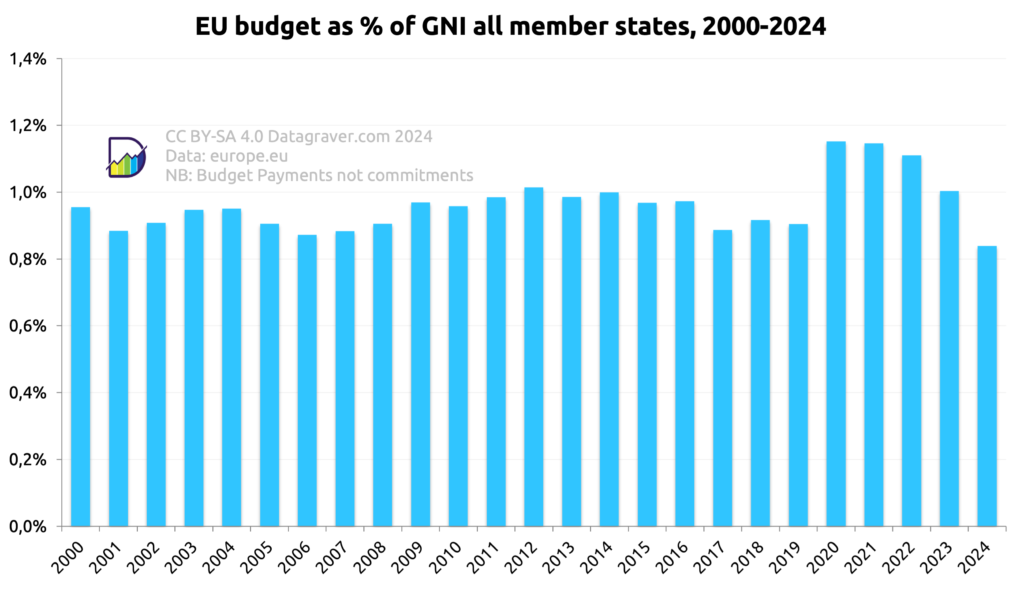
And the EU budget as percentage of the GNI (Gross National Income) of the member states.
Digging data
Overview of the EU budget for each year from 2000 onward. This concerns the Payments part of the budget.
And the EU budget as percentage of the GNI (Gross National Income) of the member states.