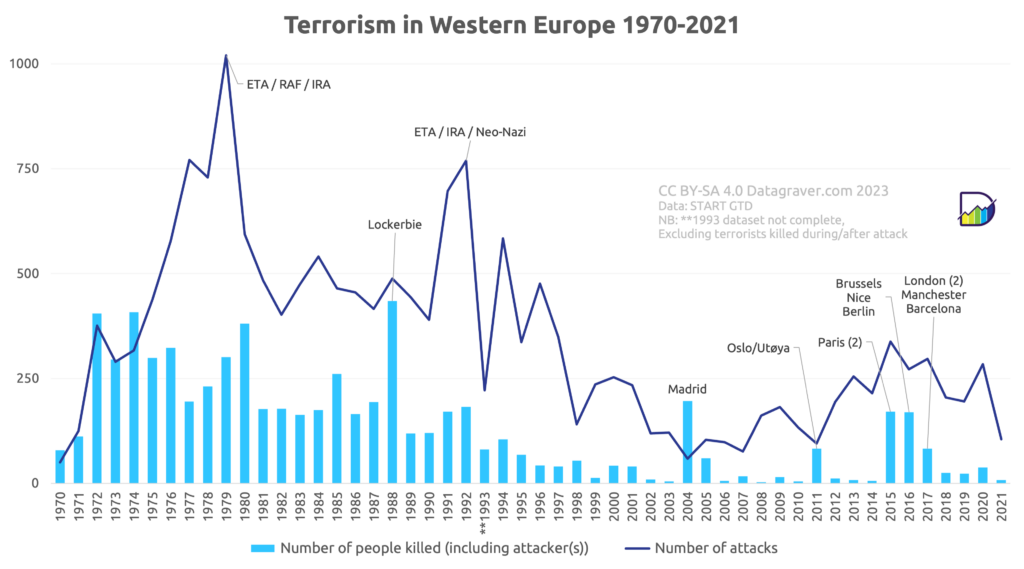
Each year Europol publishes a report on terrorism in the EU. We’ve gathered the data from all years available and created several graphs based on it.
Please not that in these graphs we have exclude the UK now, even for the years that they were still in the EU. this was done to make the data a bit more comparable over the years shown.
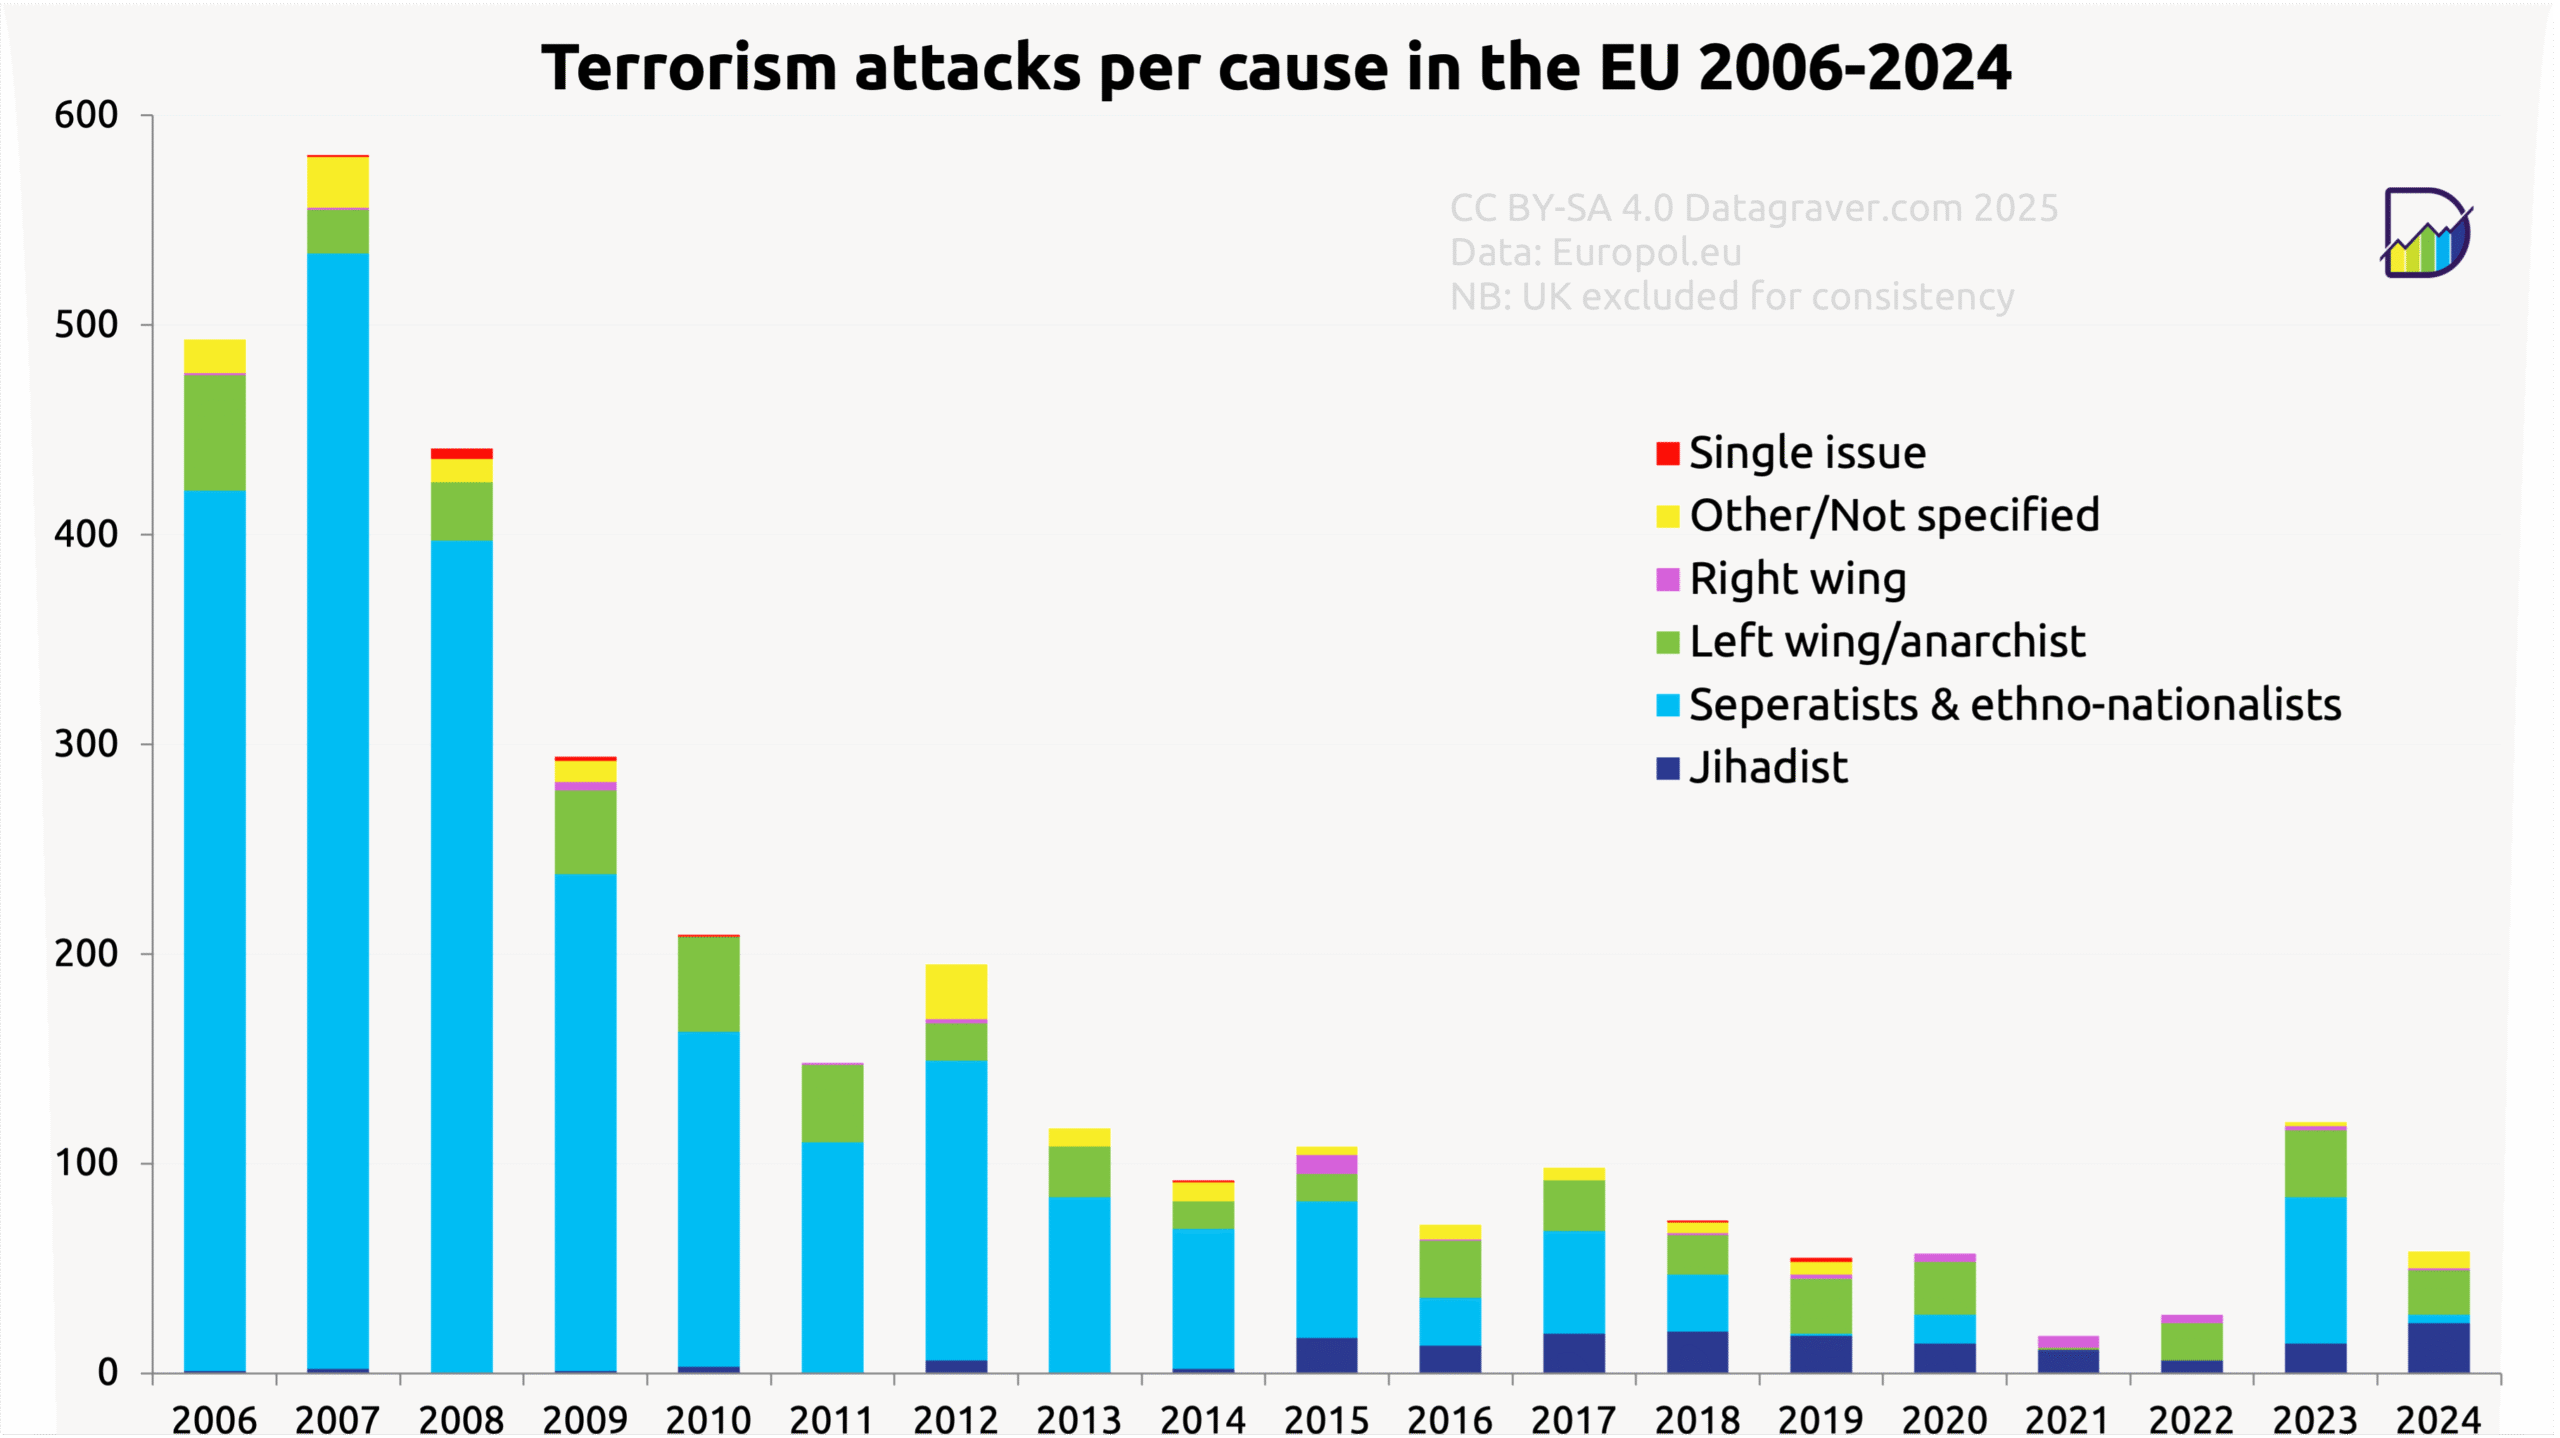
First a graph with a count of all attacks per year, split per cause (stacked bar chart).