Europol terrorism data

Each year Europol publishes a report on terrorism in the EU. We’ve gathered the data from all years available and created several graphs based on it.

Please not that in these graphs we have exclude the UK now, even for the years that they were still in the EU. this was done to make the data a bit more comparable over the years shown.

First a graph with a count of all attacks per year, split per cause (stacked bar chart).

Graph showing number of terrorism attacks in the EU since 2006, per cause.
Total number declined from almost 600 in 2007 to 28 last year.
Up to 2015 most attacks came from seperatists and ethno-nationalists.
After that year left wing and jihadists are major contributors. Except in 2021 (No left wing).
The UK is excluded from this data, even for the years they still were member of the EU.
2023 saw a sudden rise to 120 attacks, after 4 years with less than 50.

The impact from the terrorism attacks differ. Separate graph on the number of deaths by these attacks, split between jihadist and non-jihadist attacks.
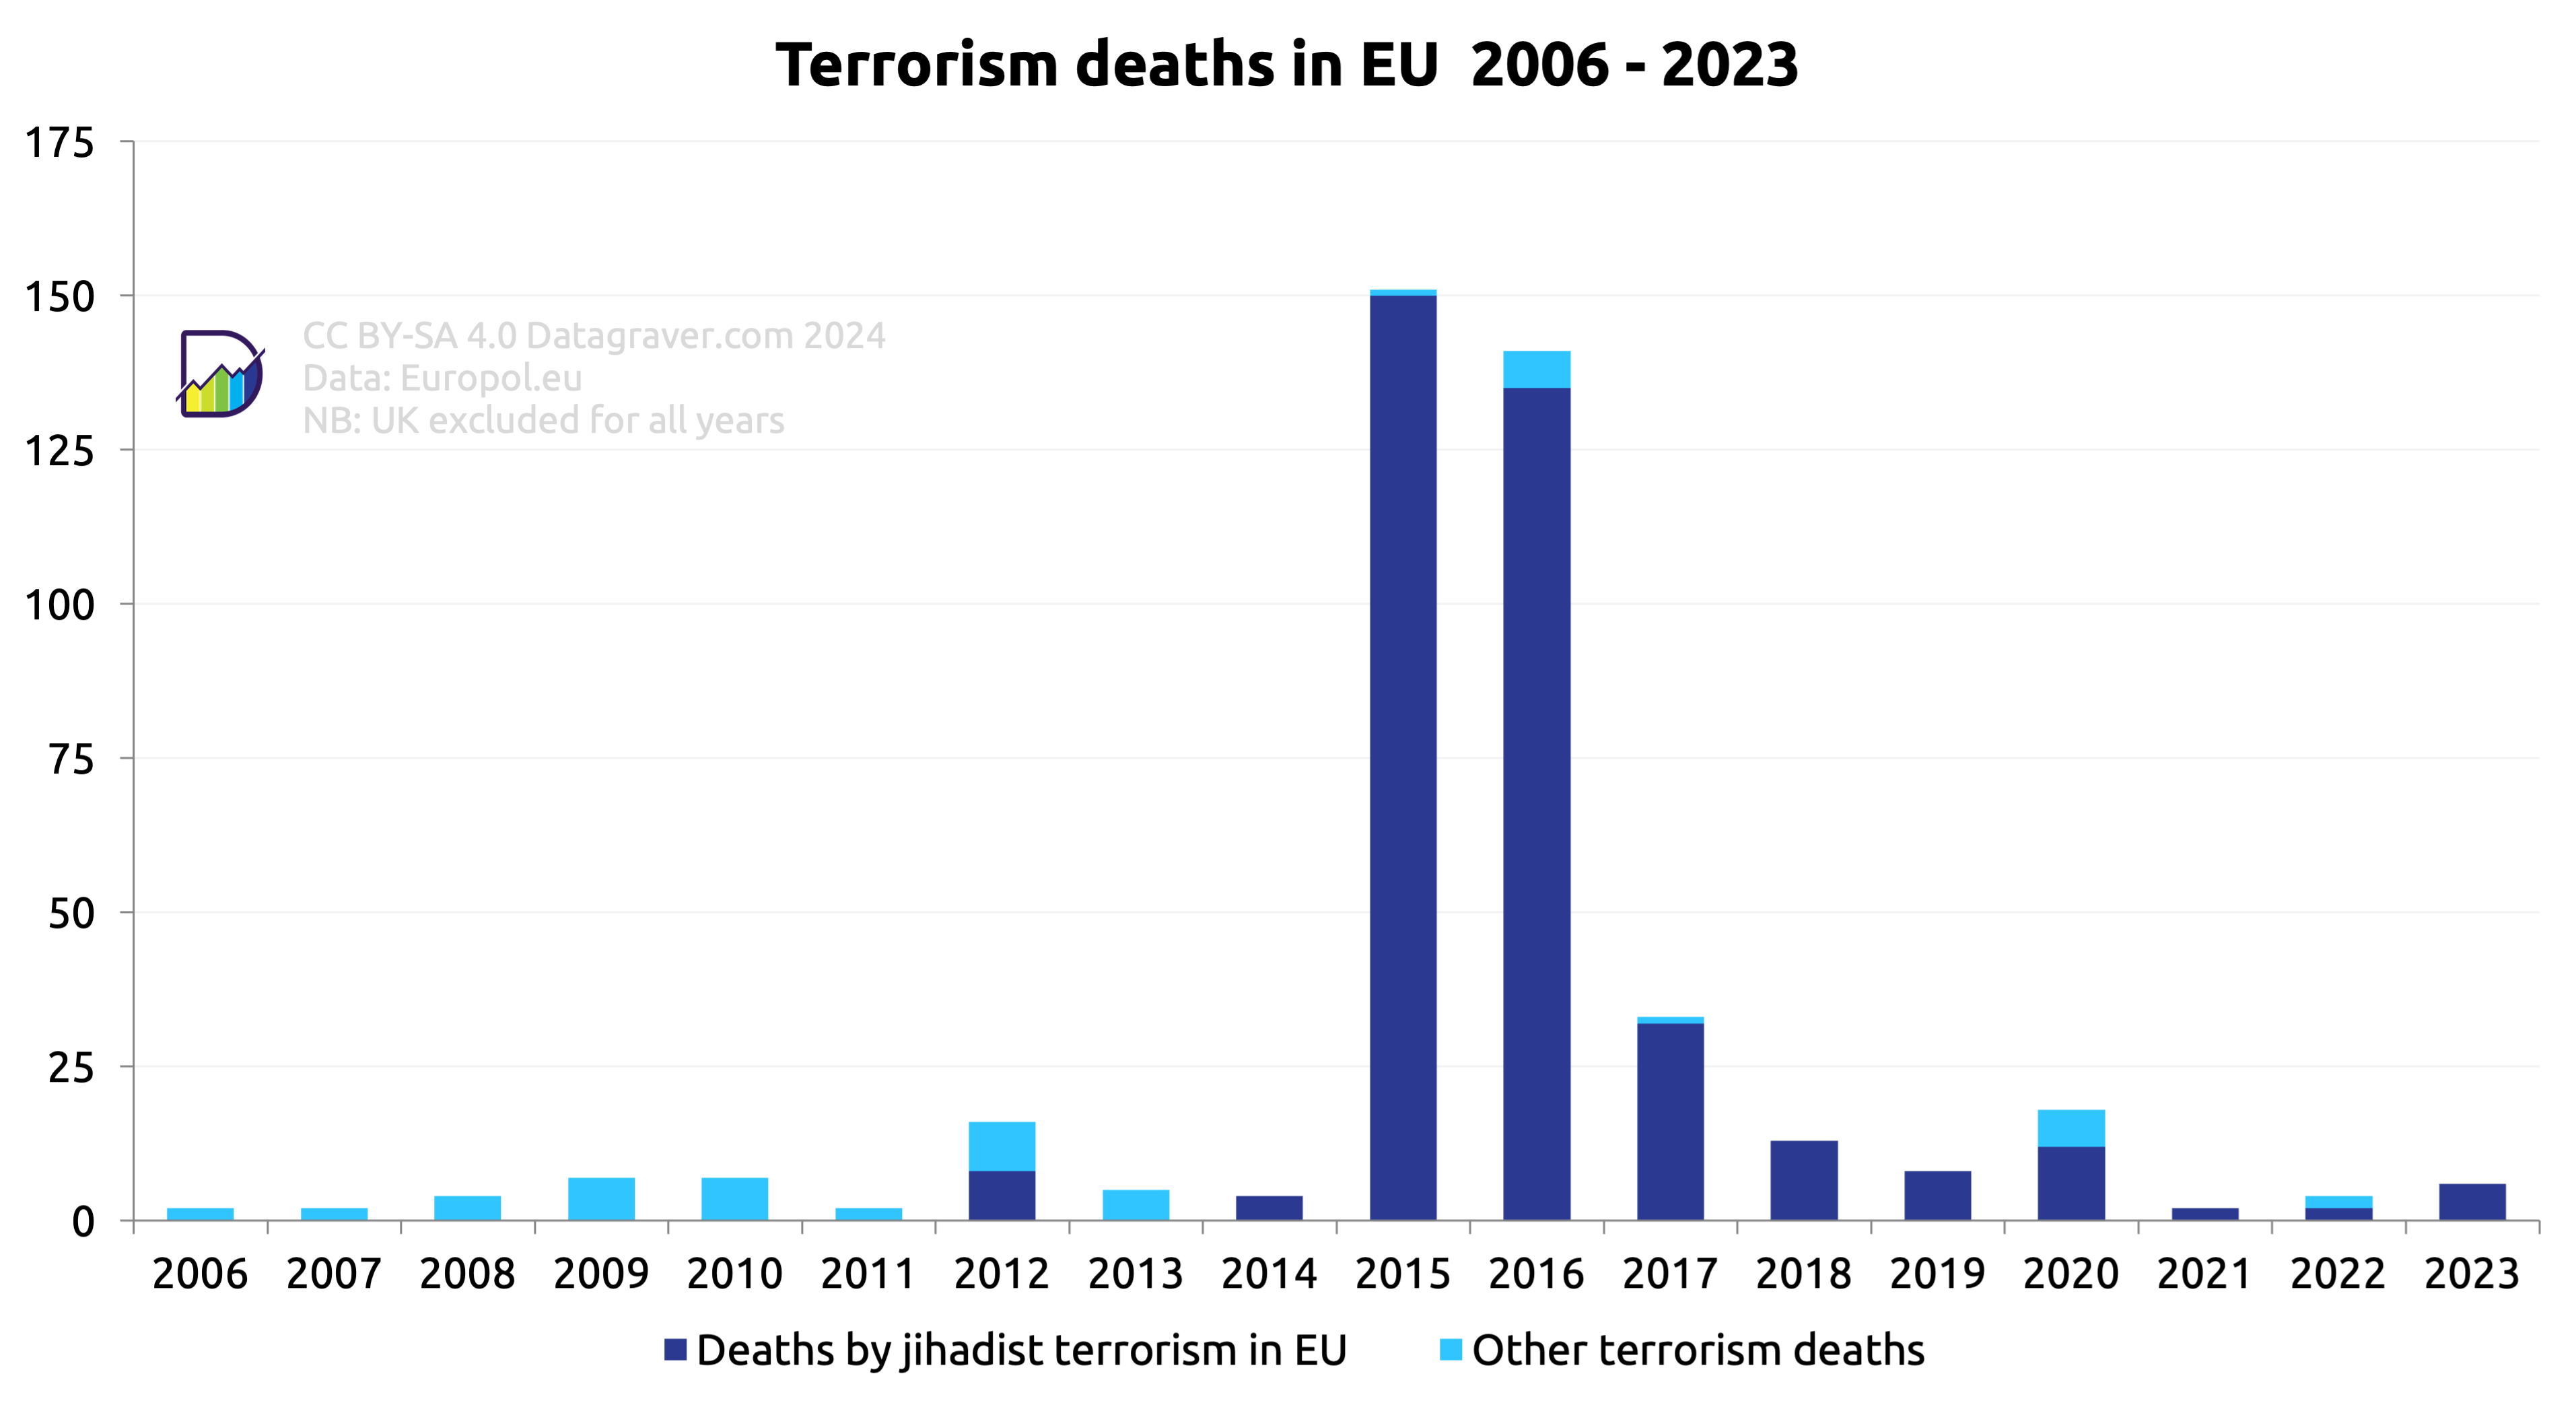
Graph with number of terrorism deaths in the EU per year.		
Split between deaths by jihadist terrorism and the rest.		
Data		
Year	Deaths by jihadist terrorism in EU	Other terrorism deaths
2006	2	0
2007	2	0
2008	4	0
2009	7	0
2010	7	0
2011	2	0
2012	8	8
2013	5	0
2014	0	4
2015	1	150
2016	6	135
2017	1	32
2018	0	13
2019	0	8
2020	6	12
2021	0	2
2022	2	2
2023	0	6

Europol also tracks the number of people arrested and convicted related to terrorism in the EU. Please note that there can be some years between arrest and conviction.
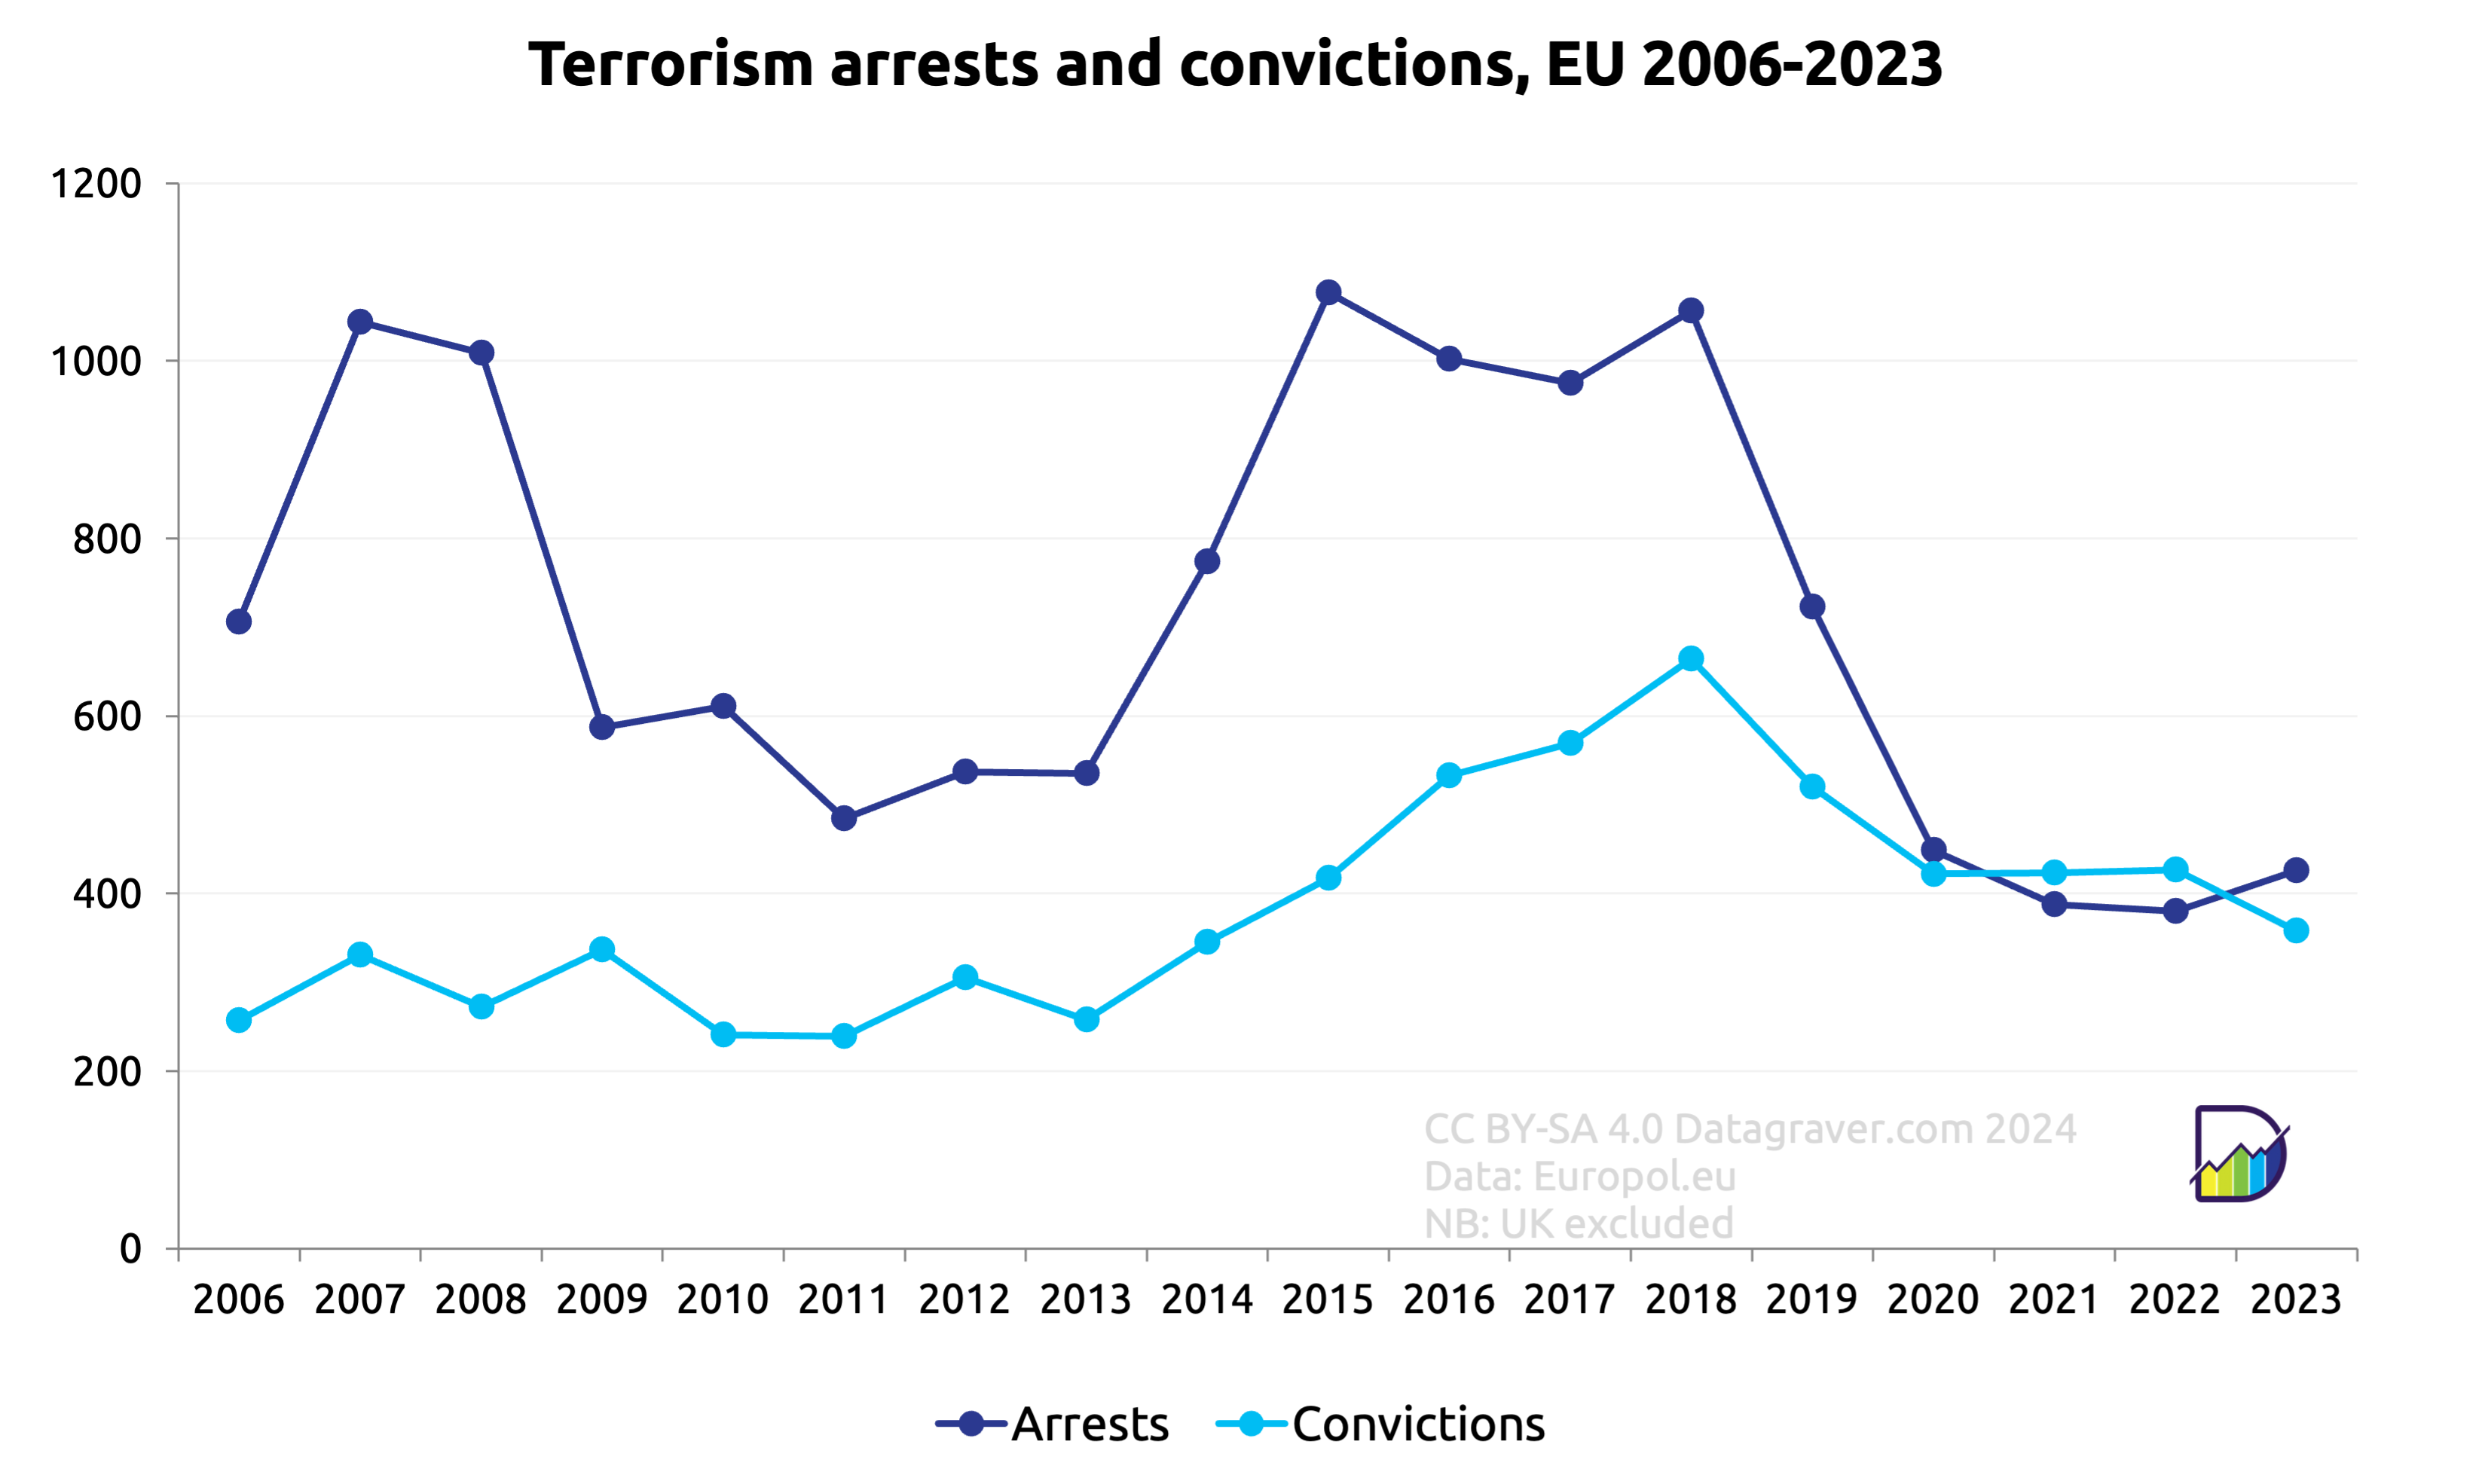
Graph with number of people arrested or convicted for terrorism in the EU (excluding the UK).
Data:
Year	Arrests	Convictions
2006	706	257
2007	1044	331
2008	1009	272
2009	587	337
2010	611	241
2011	484	239
2012	537	305
2013	535	258
2014	774	345
2015	1077	417
2016	1002	533
2017	975	569
2018	1056	664
2019	723	520
2020	449	422
2021	388	423
2022	380	427
2023	426	358