Climate data set: Berkeley Earth

Here graphs based on the Berkeley dataset (reanalysis) created by Berkeley Earth .

Regular updates. Check date in graph.
First graph is on the monthly anomalies plus a centered 10 year average.
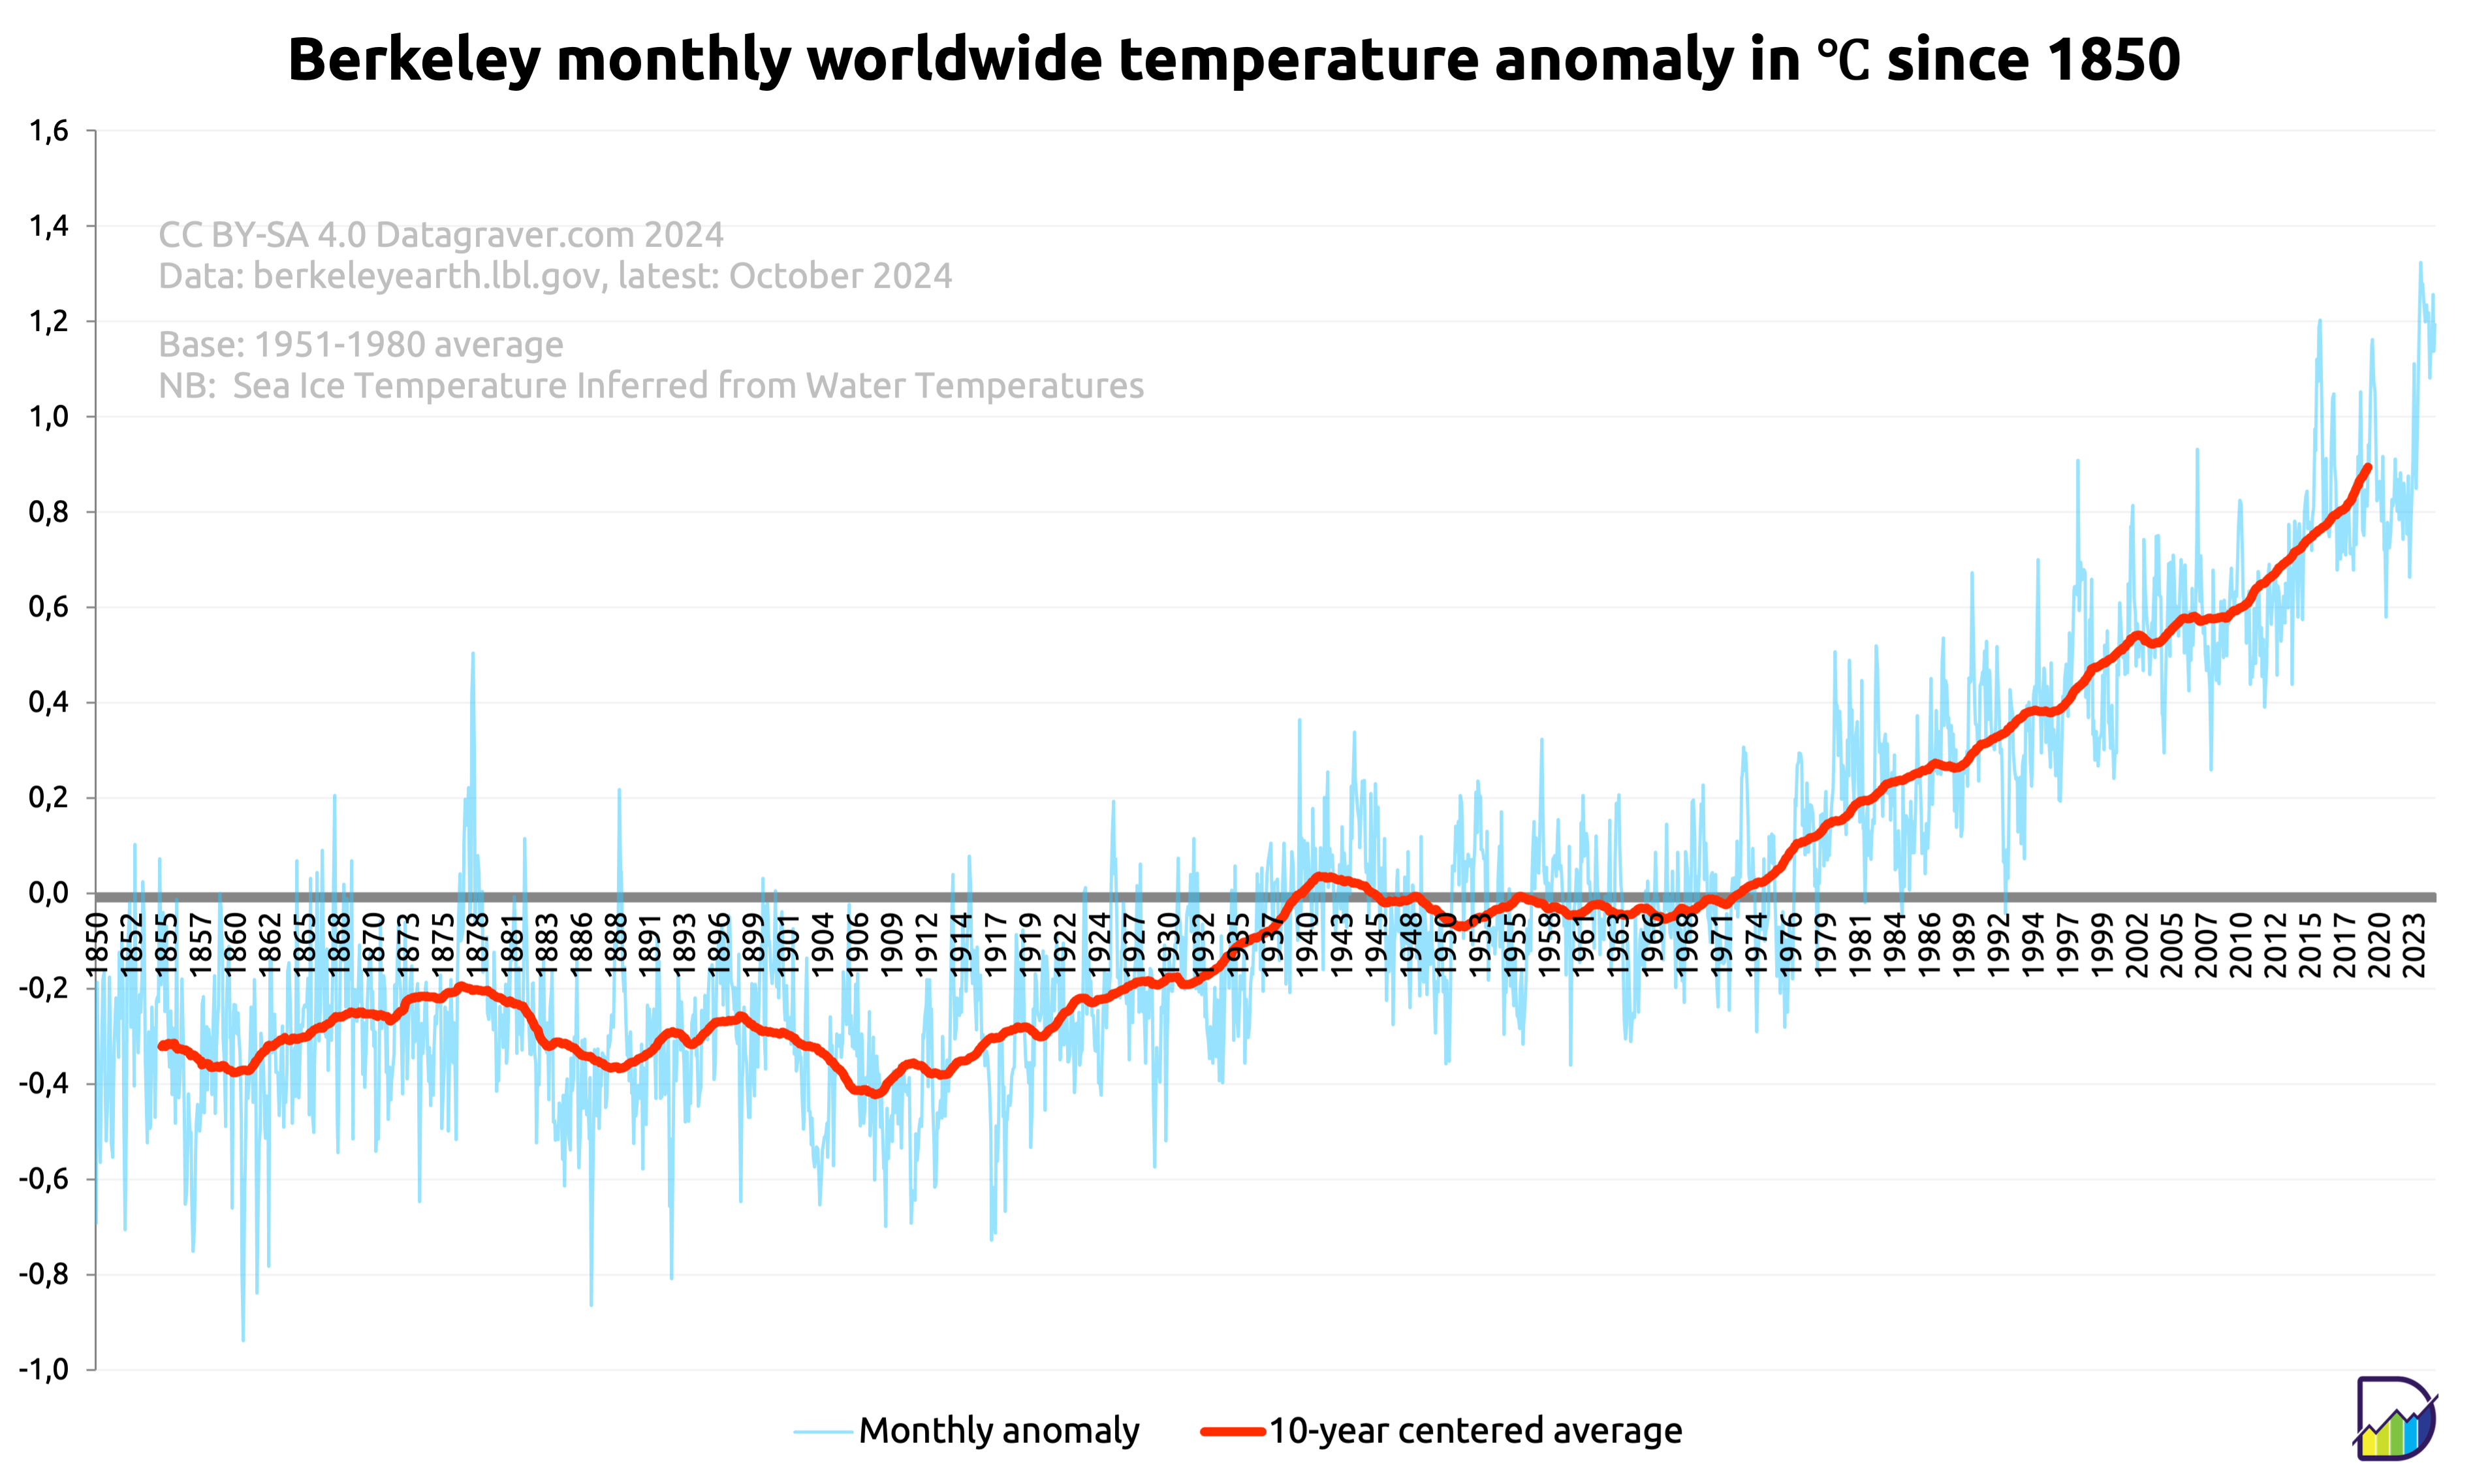
Graph with monthly world temperature anomalies compared to the 1951-1980 average, since 1850, plus a 10 year centered average.
This has gone from -0.3 around 1900 to +0.9 now.

Then the yearly averages on the monthly anomalies.
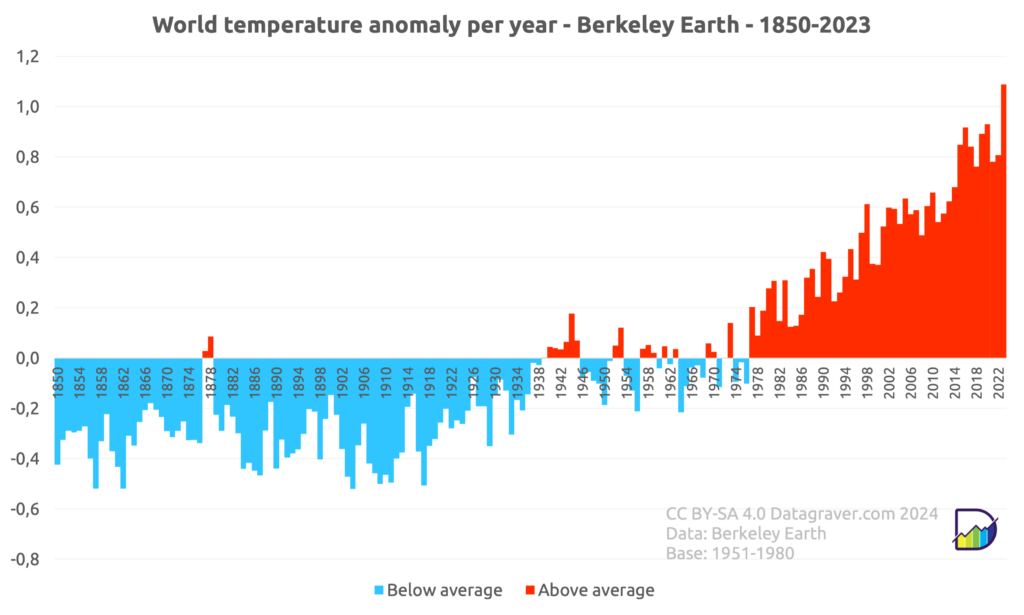
Graph with yearly world temperature anomalies since 1850 compared to 1951-1980 average. Steady rise since end of the seventies when it came above zero. Last 7 years it's around +0.8
But 2023 at +1.1

And the centered 30 year average on the monthly anomalies.
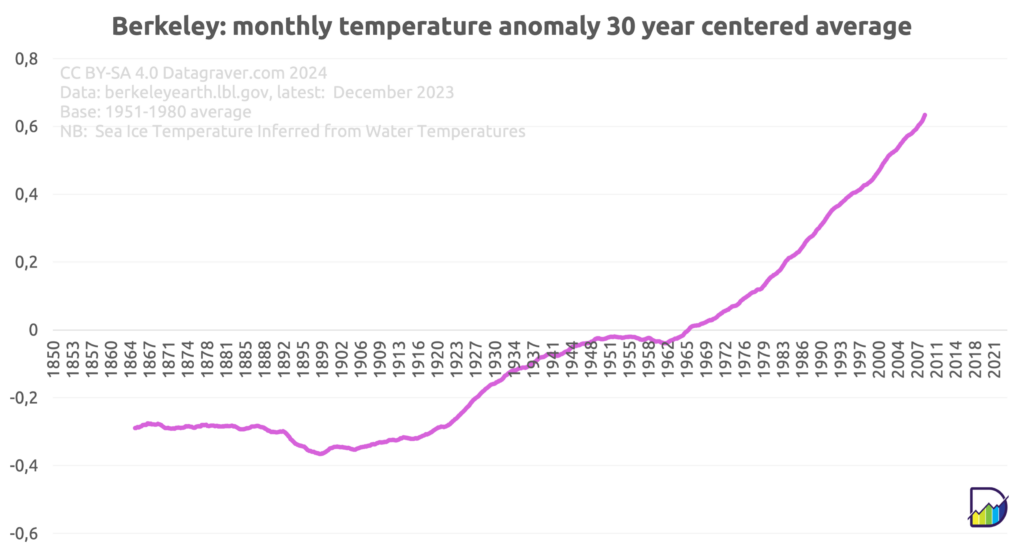
Graph with the centered 30 year average on the monthly world temperature anomalies since 1850 compared to the 1951-1980 average.  Starting at -0.3 and now at +0.64