Climate data set: REMSS

Here graphs based on the REMSS dataset.

Regular updates. Check date in graph.
First graph is on the monthly anomalies plus a centered 10 year average.
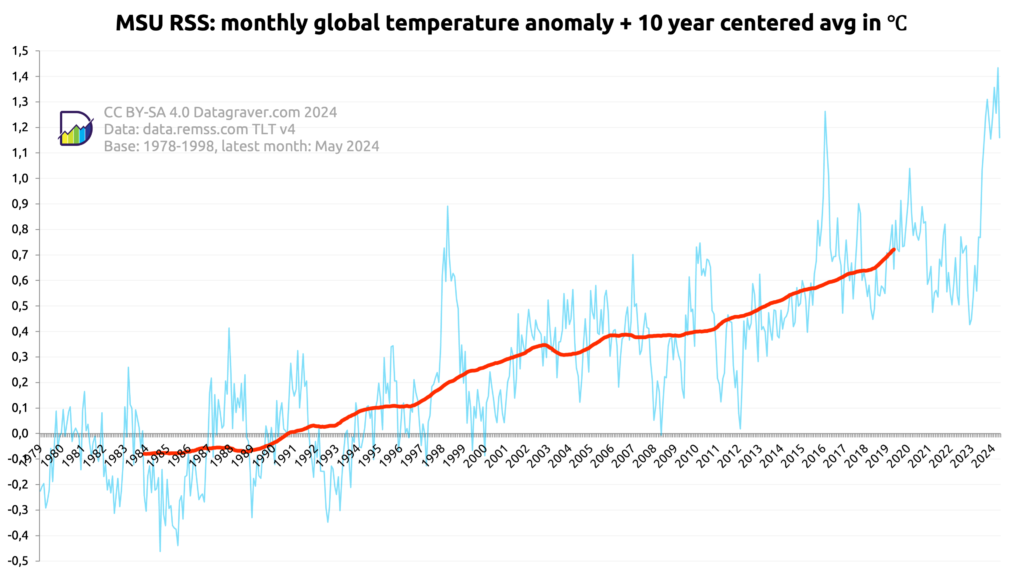
Graph showing the monthly world temperature anomalies since 1979 compared to period 1978-1998 as published by REMSS. Combined with a 10 year centered average. The centered average starts at -0.05 and is now at +0.74.
The monthly values are between -0.45 and +1.3
The last 5 years it is varying between 0.4 and 0.8 with a few exceptions upwards, but last eight months above 1 and in April 2024 +1.434.

Then the yearly averages on the monthly anomalies.
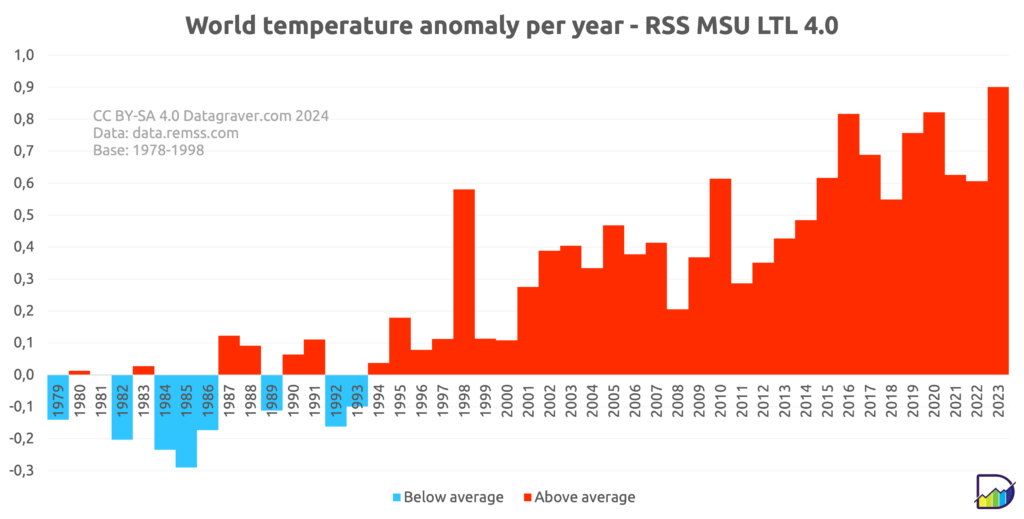
Graph showing yearly average anomalies on world temperature compared to the 1978-1998 period.
Started in 1979 at -0.1. Now above +0.9

And the centered 30 year average on the monthly anomalies.
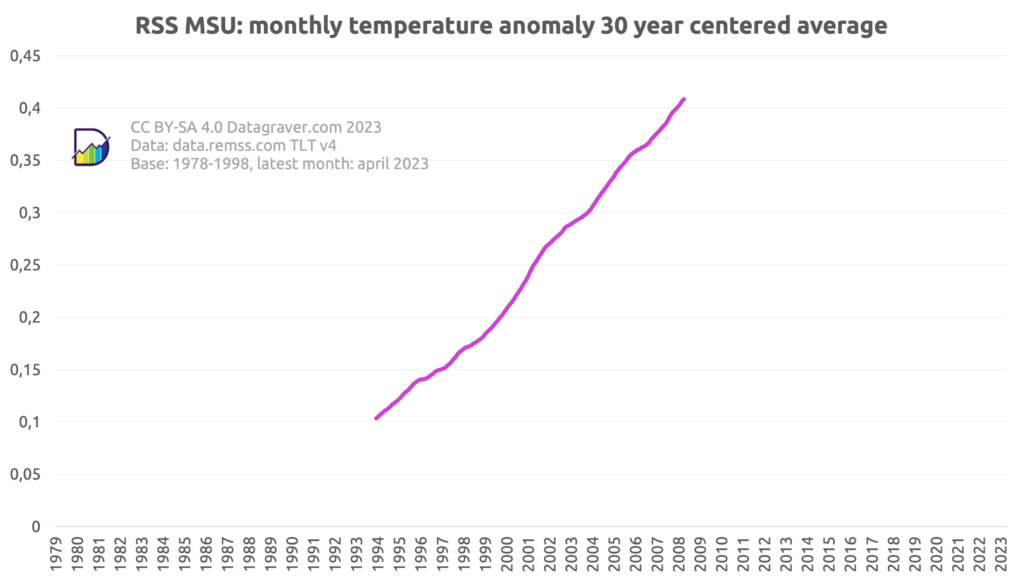
Graph showing 30 year centered average on monthly world temperature anomalies. Starting in 1993 with 0.1, rising to 2007 with 0.4, compared to the 1978-1998 average.