Climate data set: Copernicus ERA5

Here graphs based on the climate data set created by Copernicus Programme as implemented by ECMWF.

Regular updates. Check date in graph.
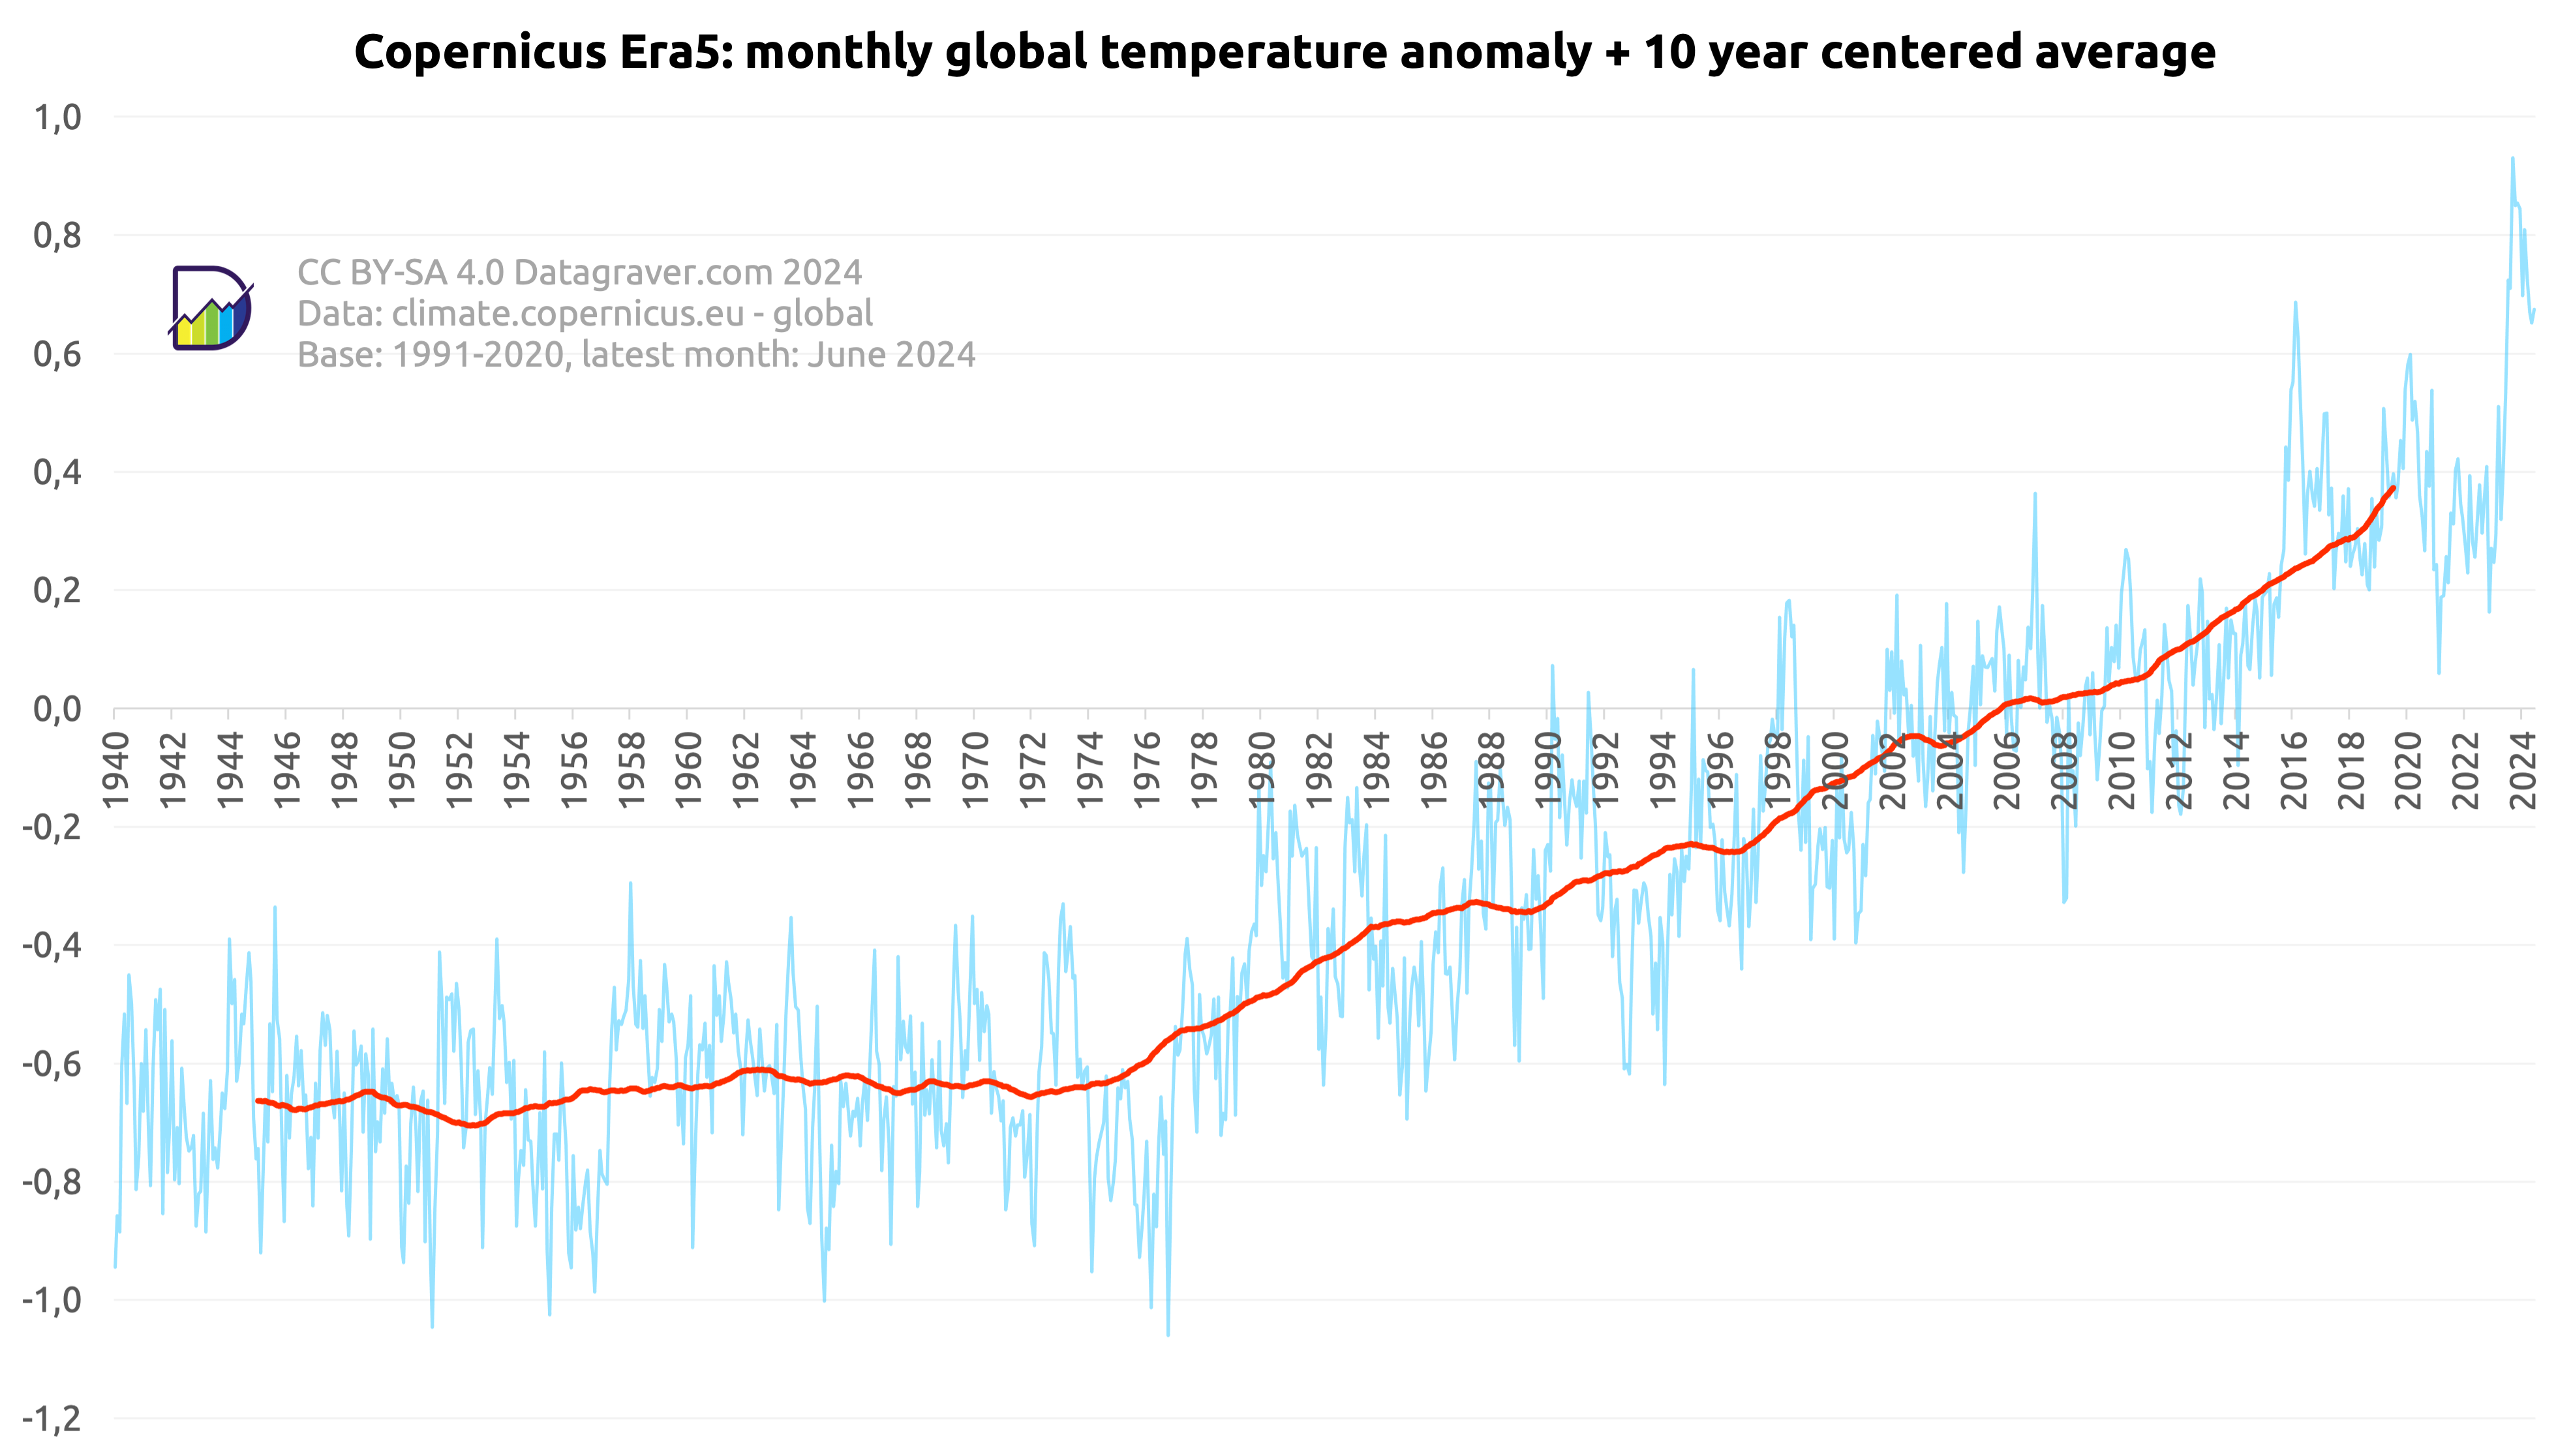
First graph is on the monthly anomalies plus a 10 year centered average.

Graph with monthly world temperature anomalies since 1979 compared to the 1991-2020 period, combined with a 10 year centered average. The 10 year average shows a steady rise from -0.19 to now +0.49.

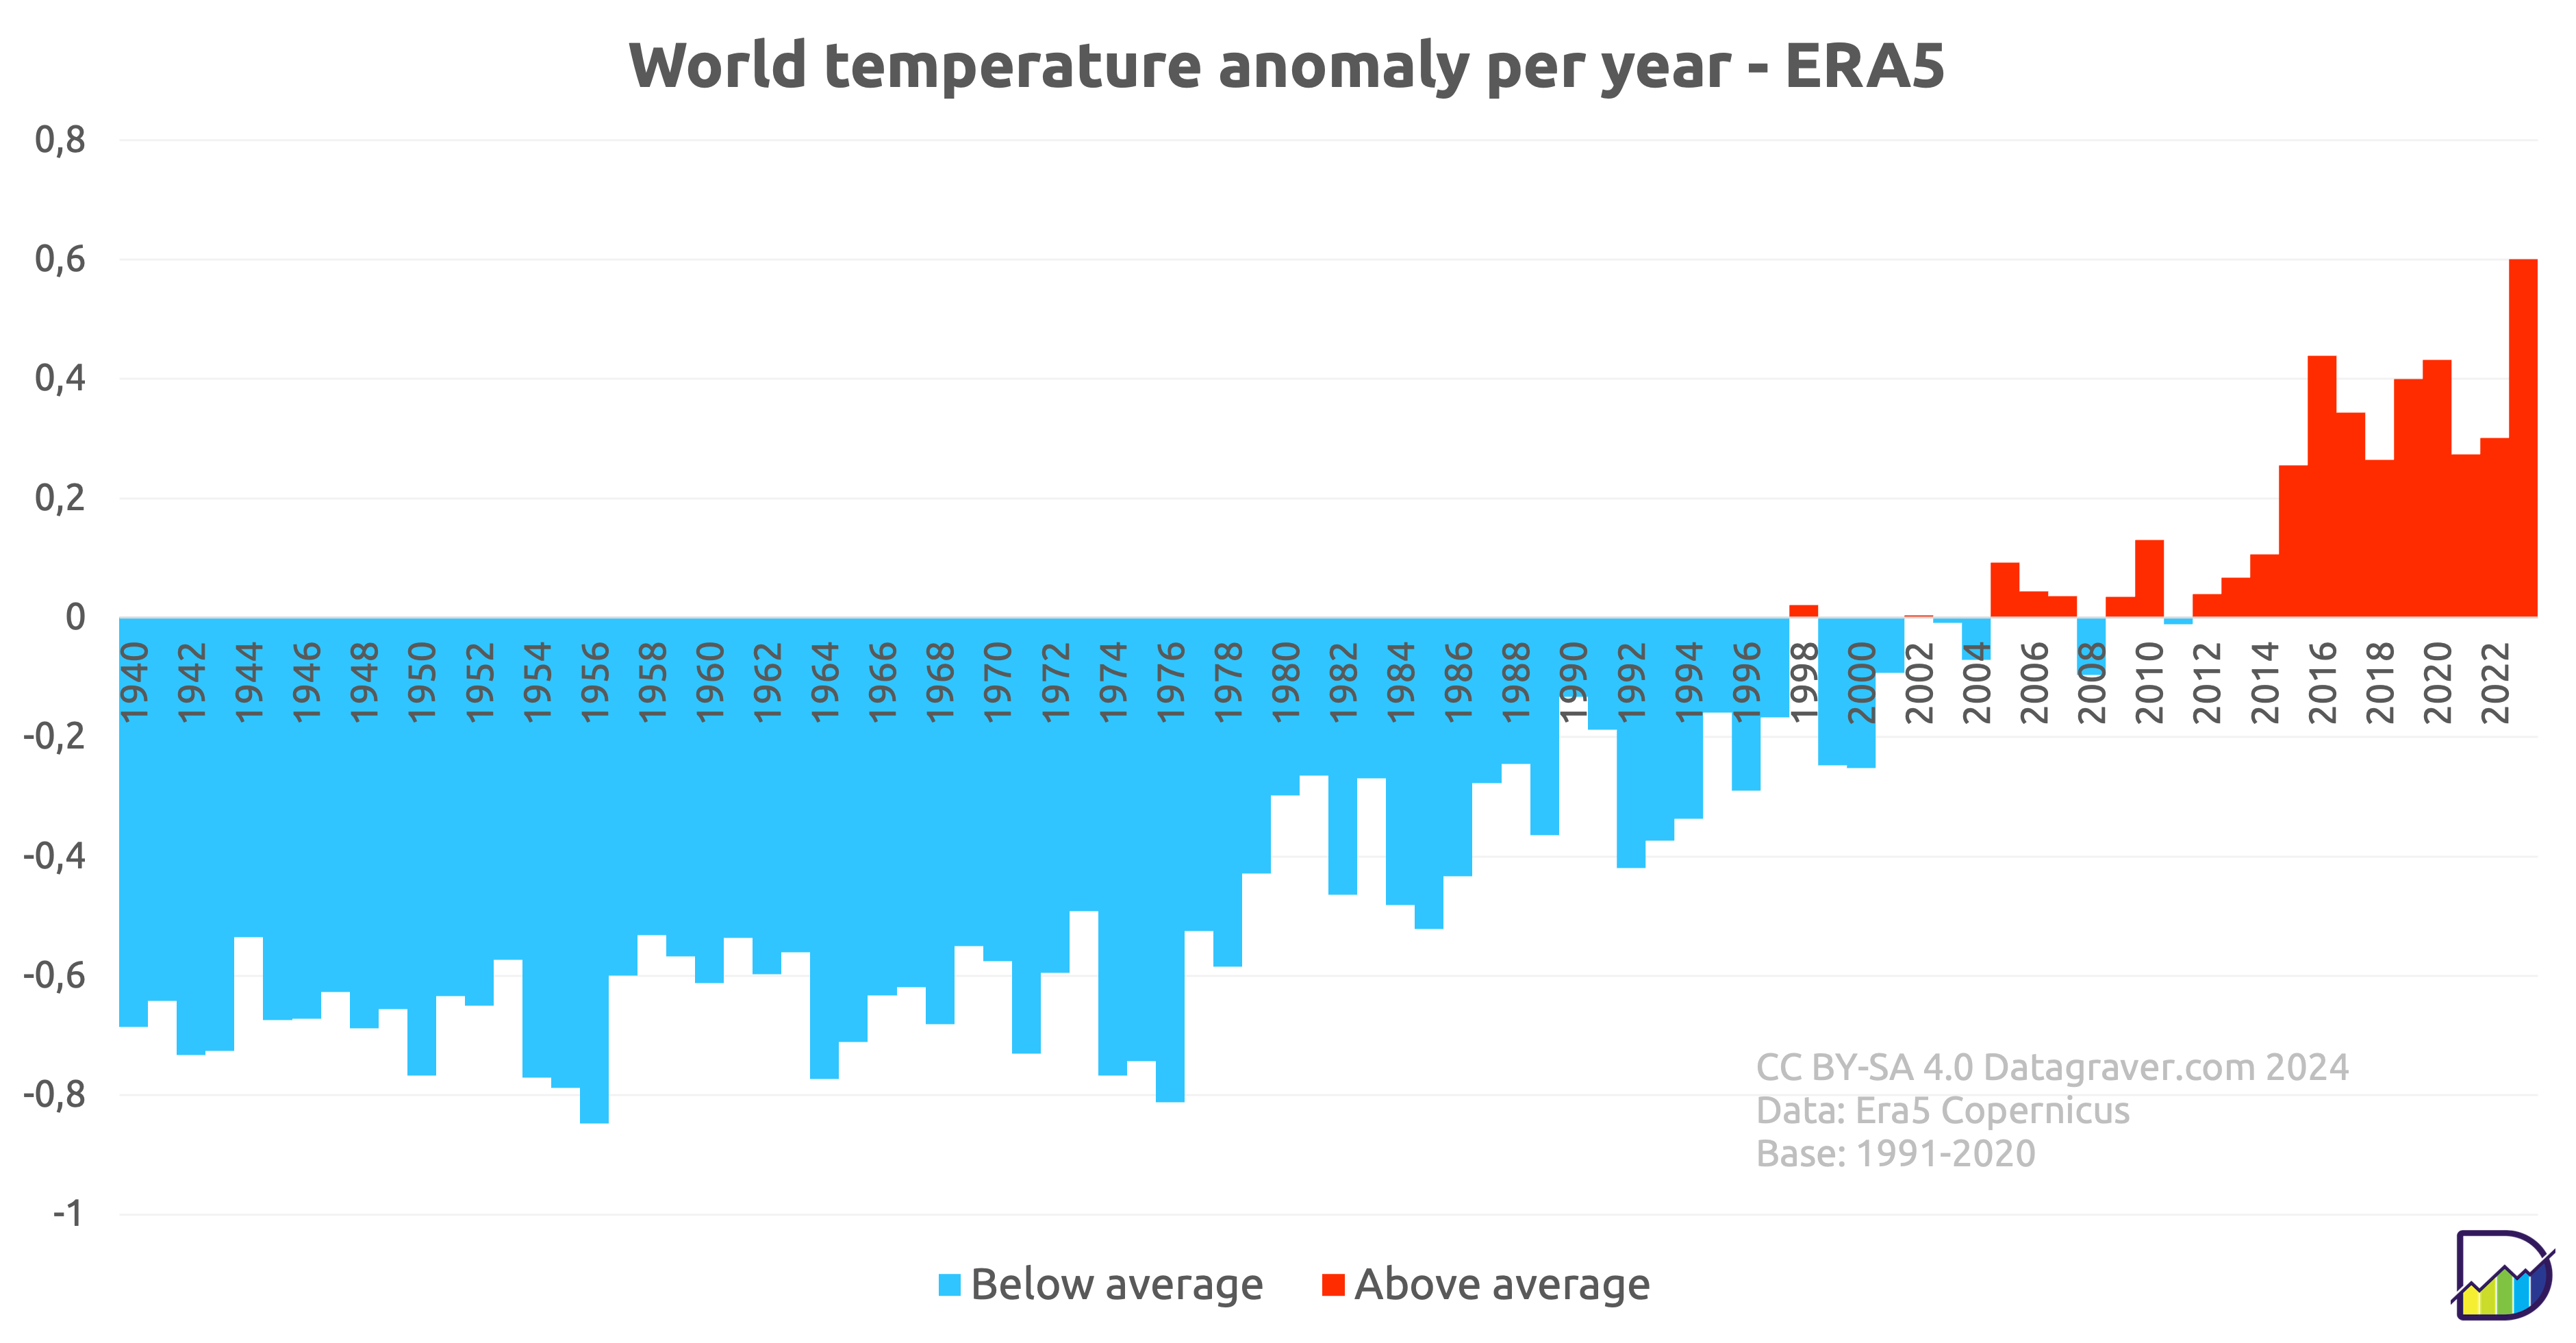
The yearly anomalies.

Graph with yearly world temperature anomalies compared to the 1991-2020 average. For period before 2000 it was around -0.3. For the last 8 years it's +0.25.

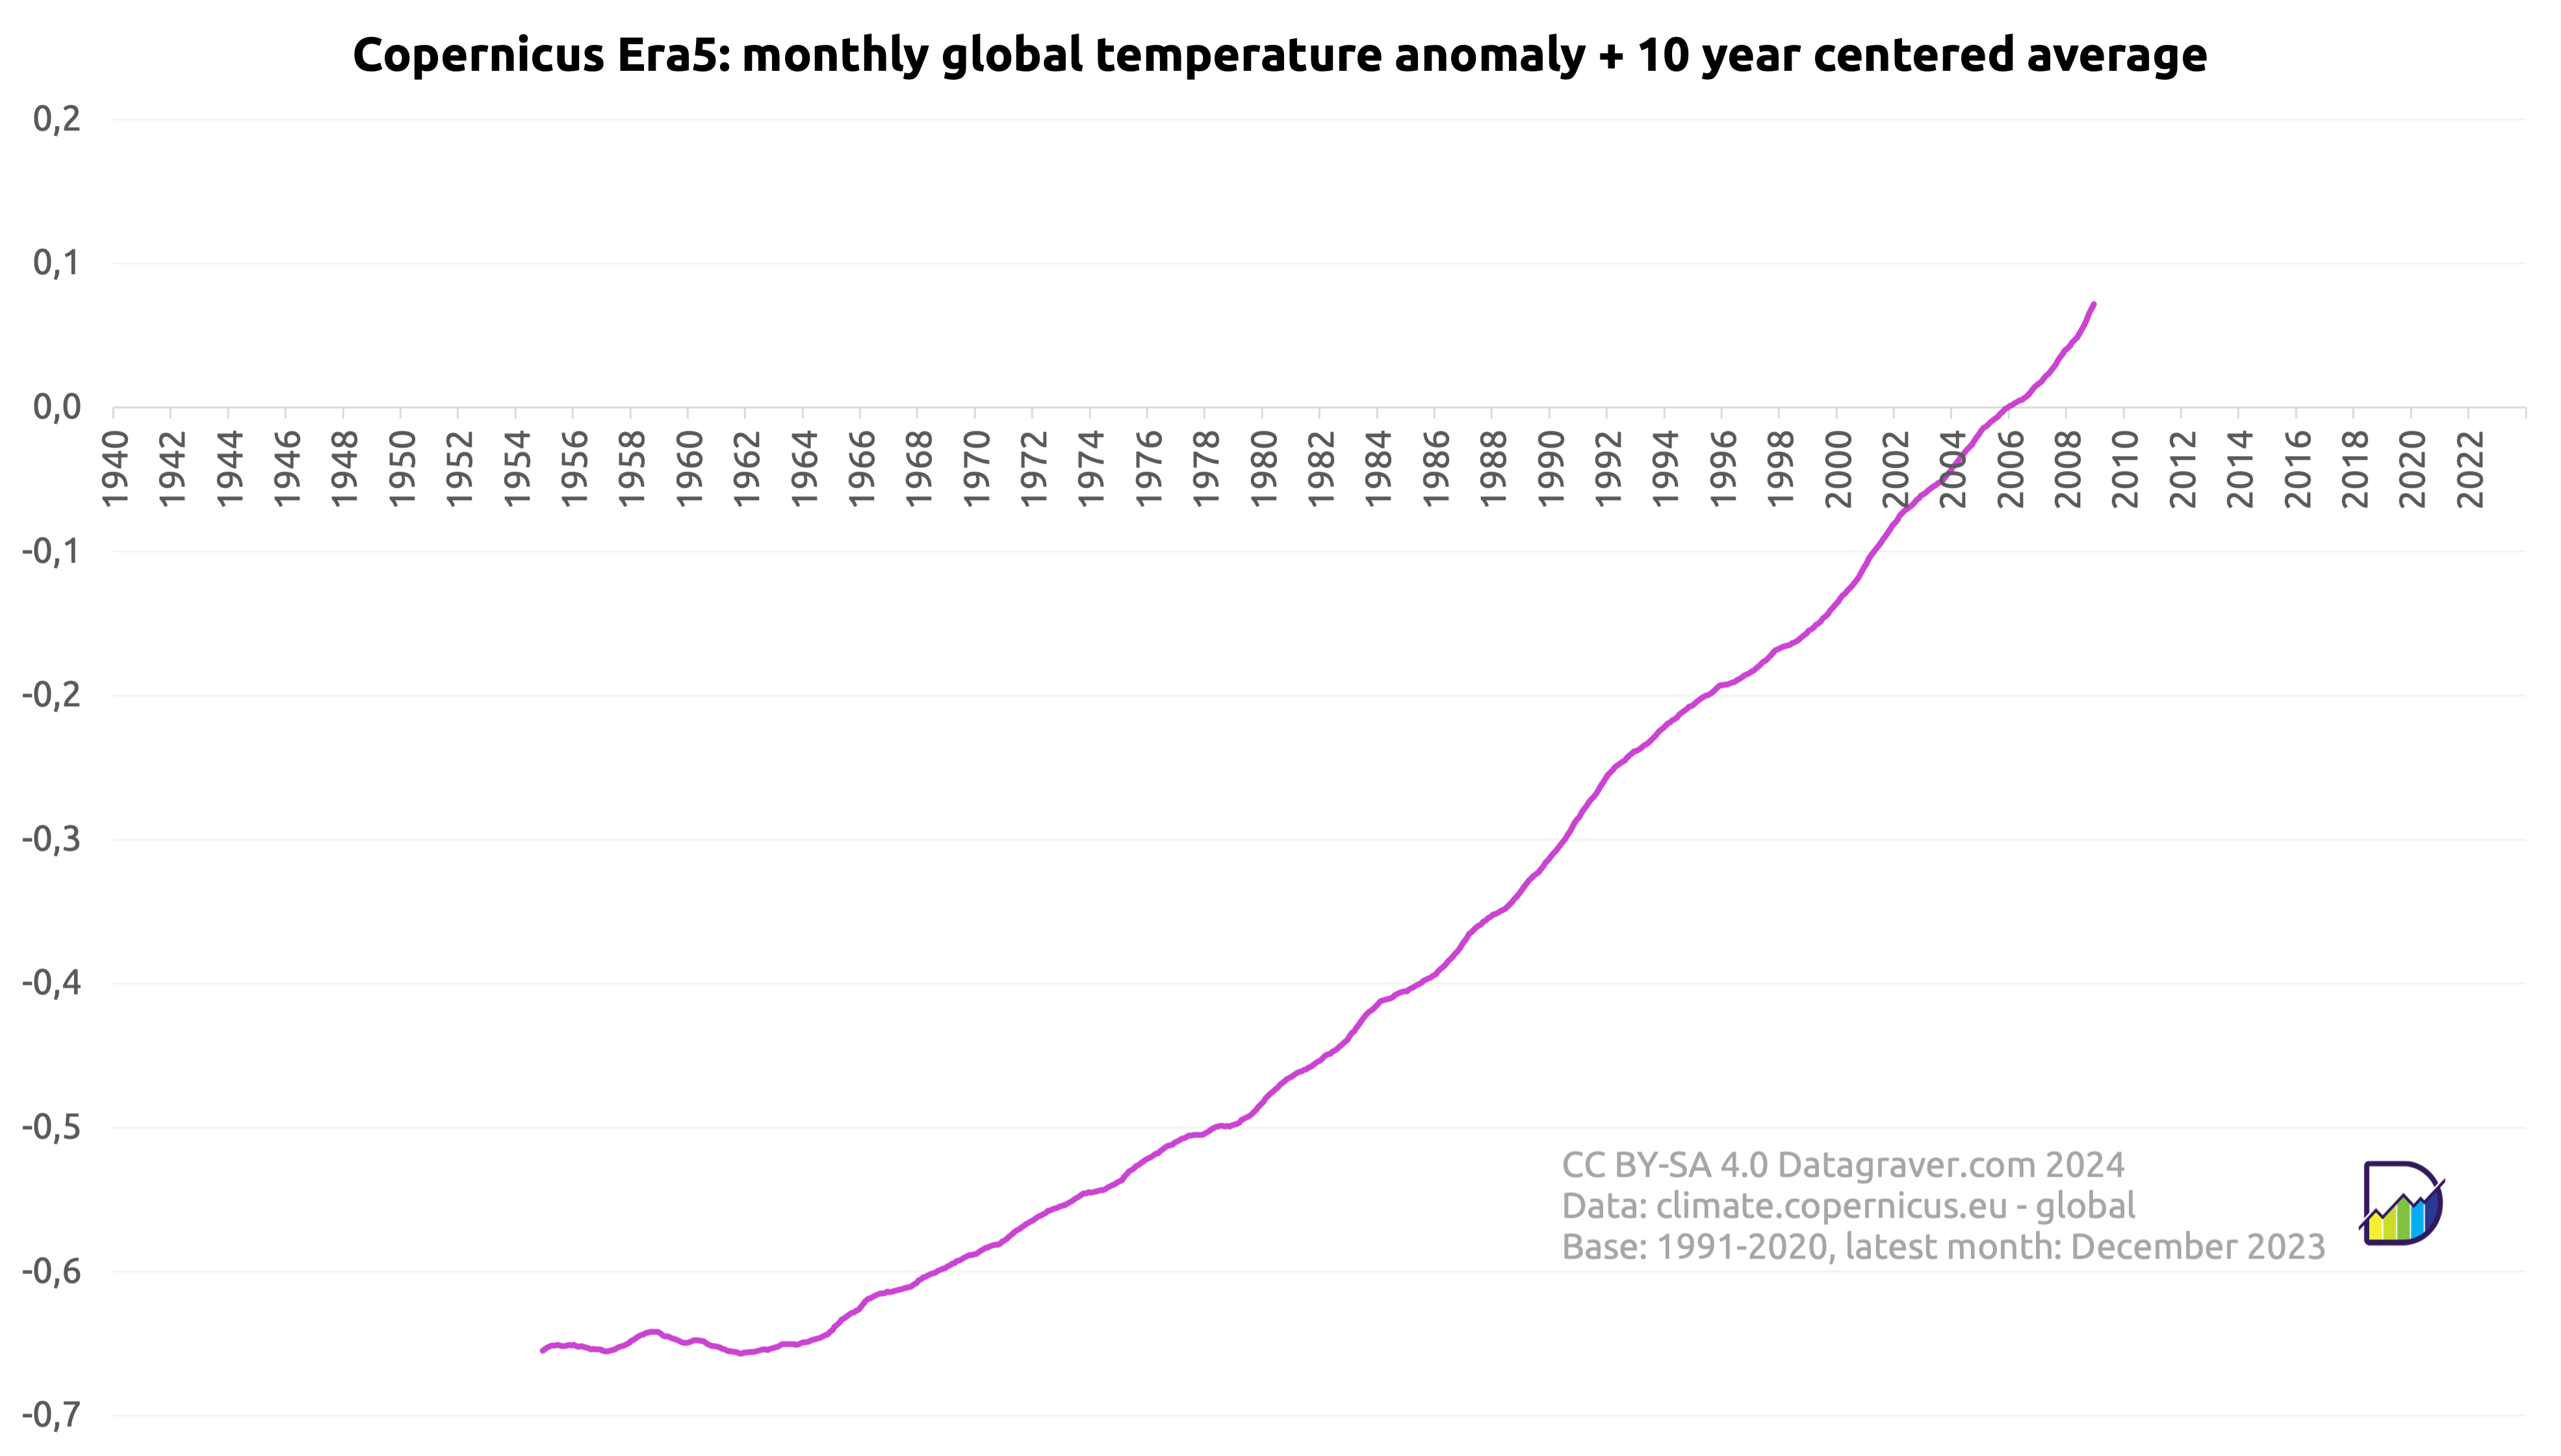
And the 30-year average (centered) on the monthly anomalies, what we refer to as climate signal.
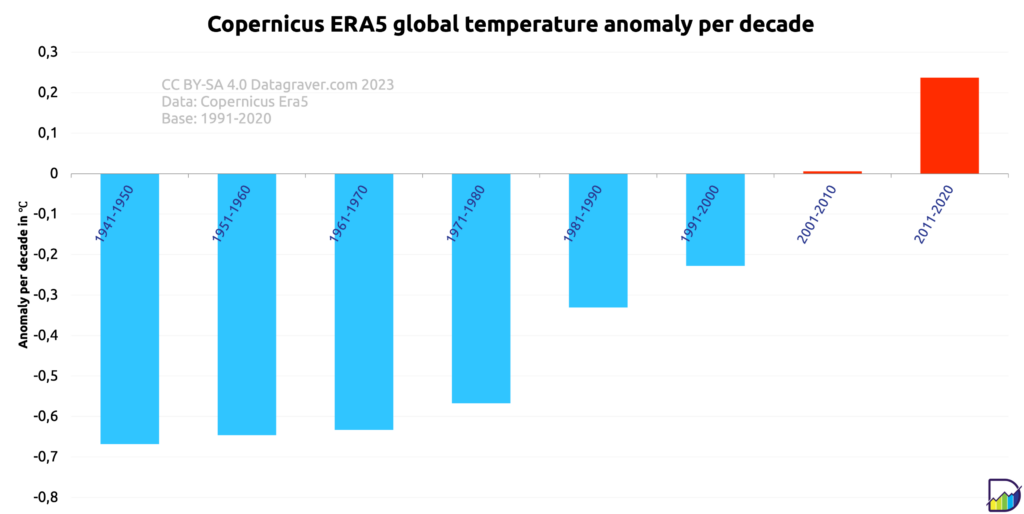
Graph with 30 year centered average on world temperature anomalies compared to the 1991-2020 average. It starts at -0.28 (1993) and is now at +0.04 (2007)

Geef een reactie

Het e-mailadres wordt niet gepubliceerd. Vereiste velden zijn gemarkeerd met *