Estimated number of available nuclear warheads per country

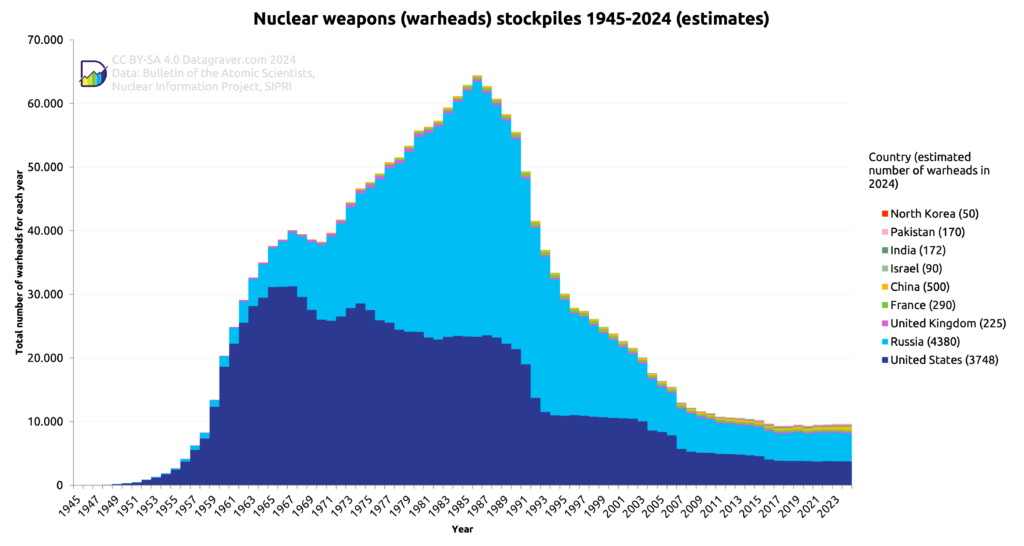
The estimated number of available (usable) nuclear warheads per country since 1945. Data available on data.world.

First as stacked bars to show the totals. Current count is behind country name.

Graph showing the count of nuclear warheads (usable) per country summed per year since 1945.
Starting at zero fast growth between 1950 and 1965 up to 40.000 warheads. Short periode of decline till 1970 followed by growth till peak in 1986 with almost 65.000 warheads. After that a rapid decline till 2005 at just over 10.000, follow by a slow decline. We are now at an estimated 9.500 warheads. 
Breakdown to countries:
North Korea - 30
Pakistan - 170
India - 164
Israel - 90
China - 410
France - 290
United Kingdom - 225
Russia - 4489
United States - 3708

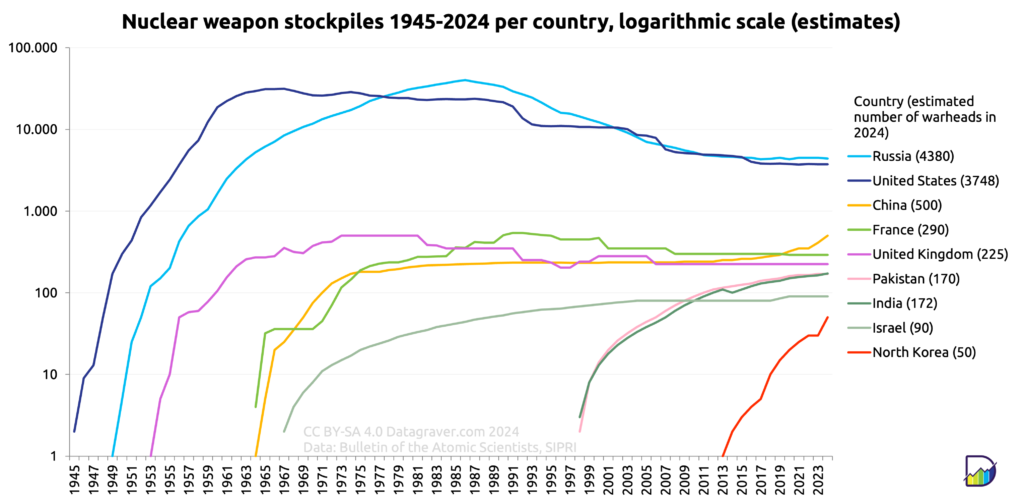
Next as individual lines, but on a log-scale. This makes it easier to see the trend for the countries with less warheads.
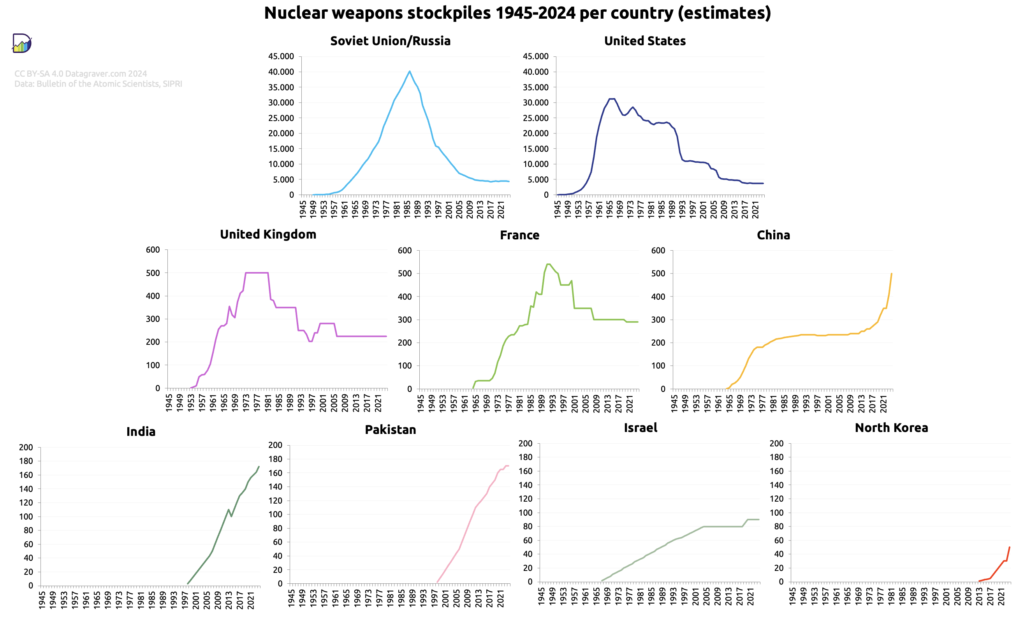
Graph with per country the count of available nuclear warheads per year since 1945.