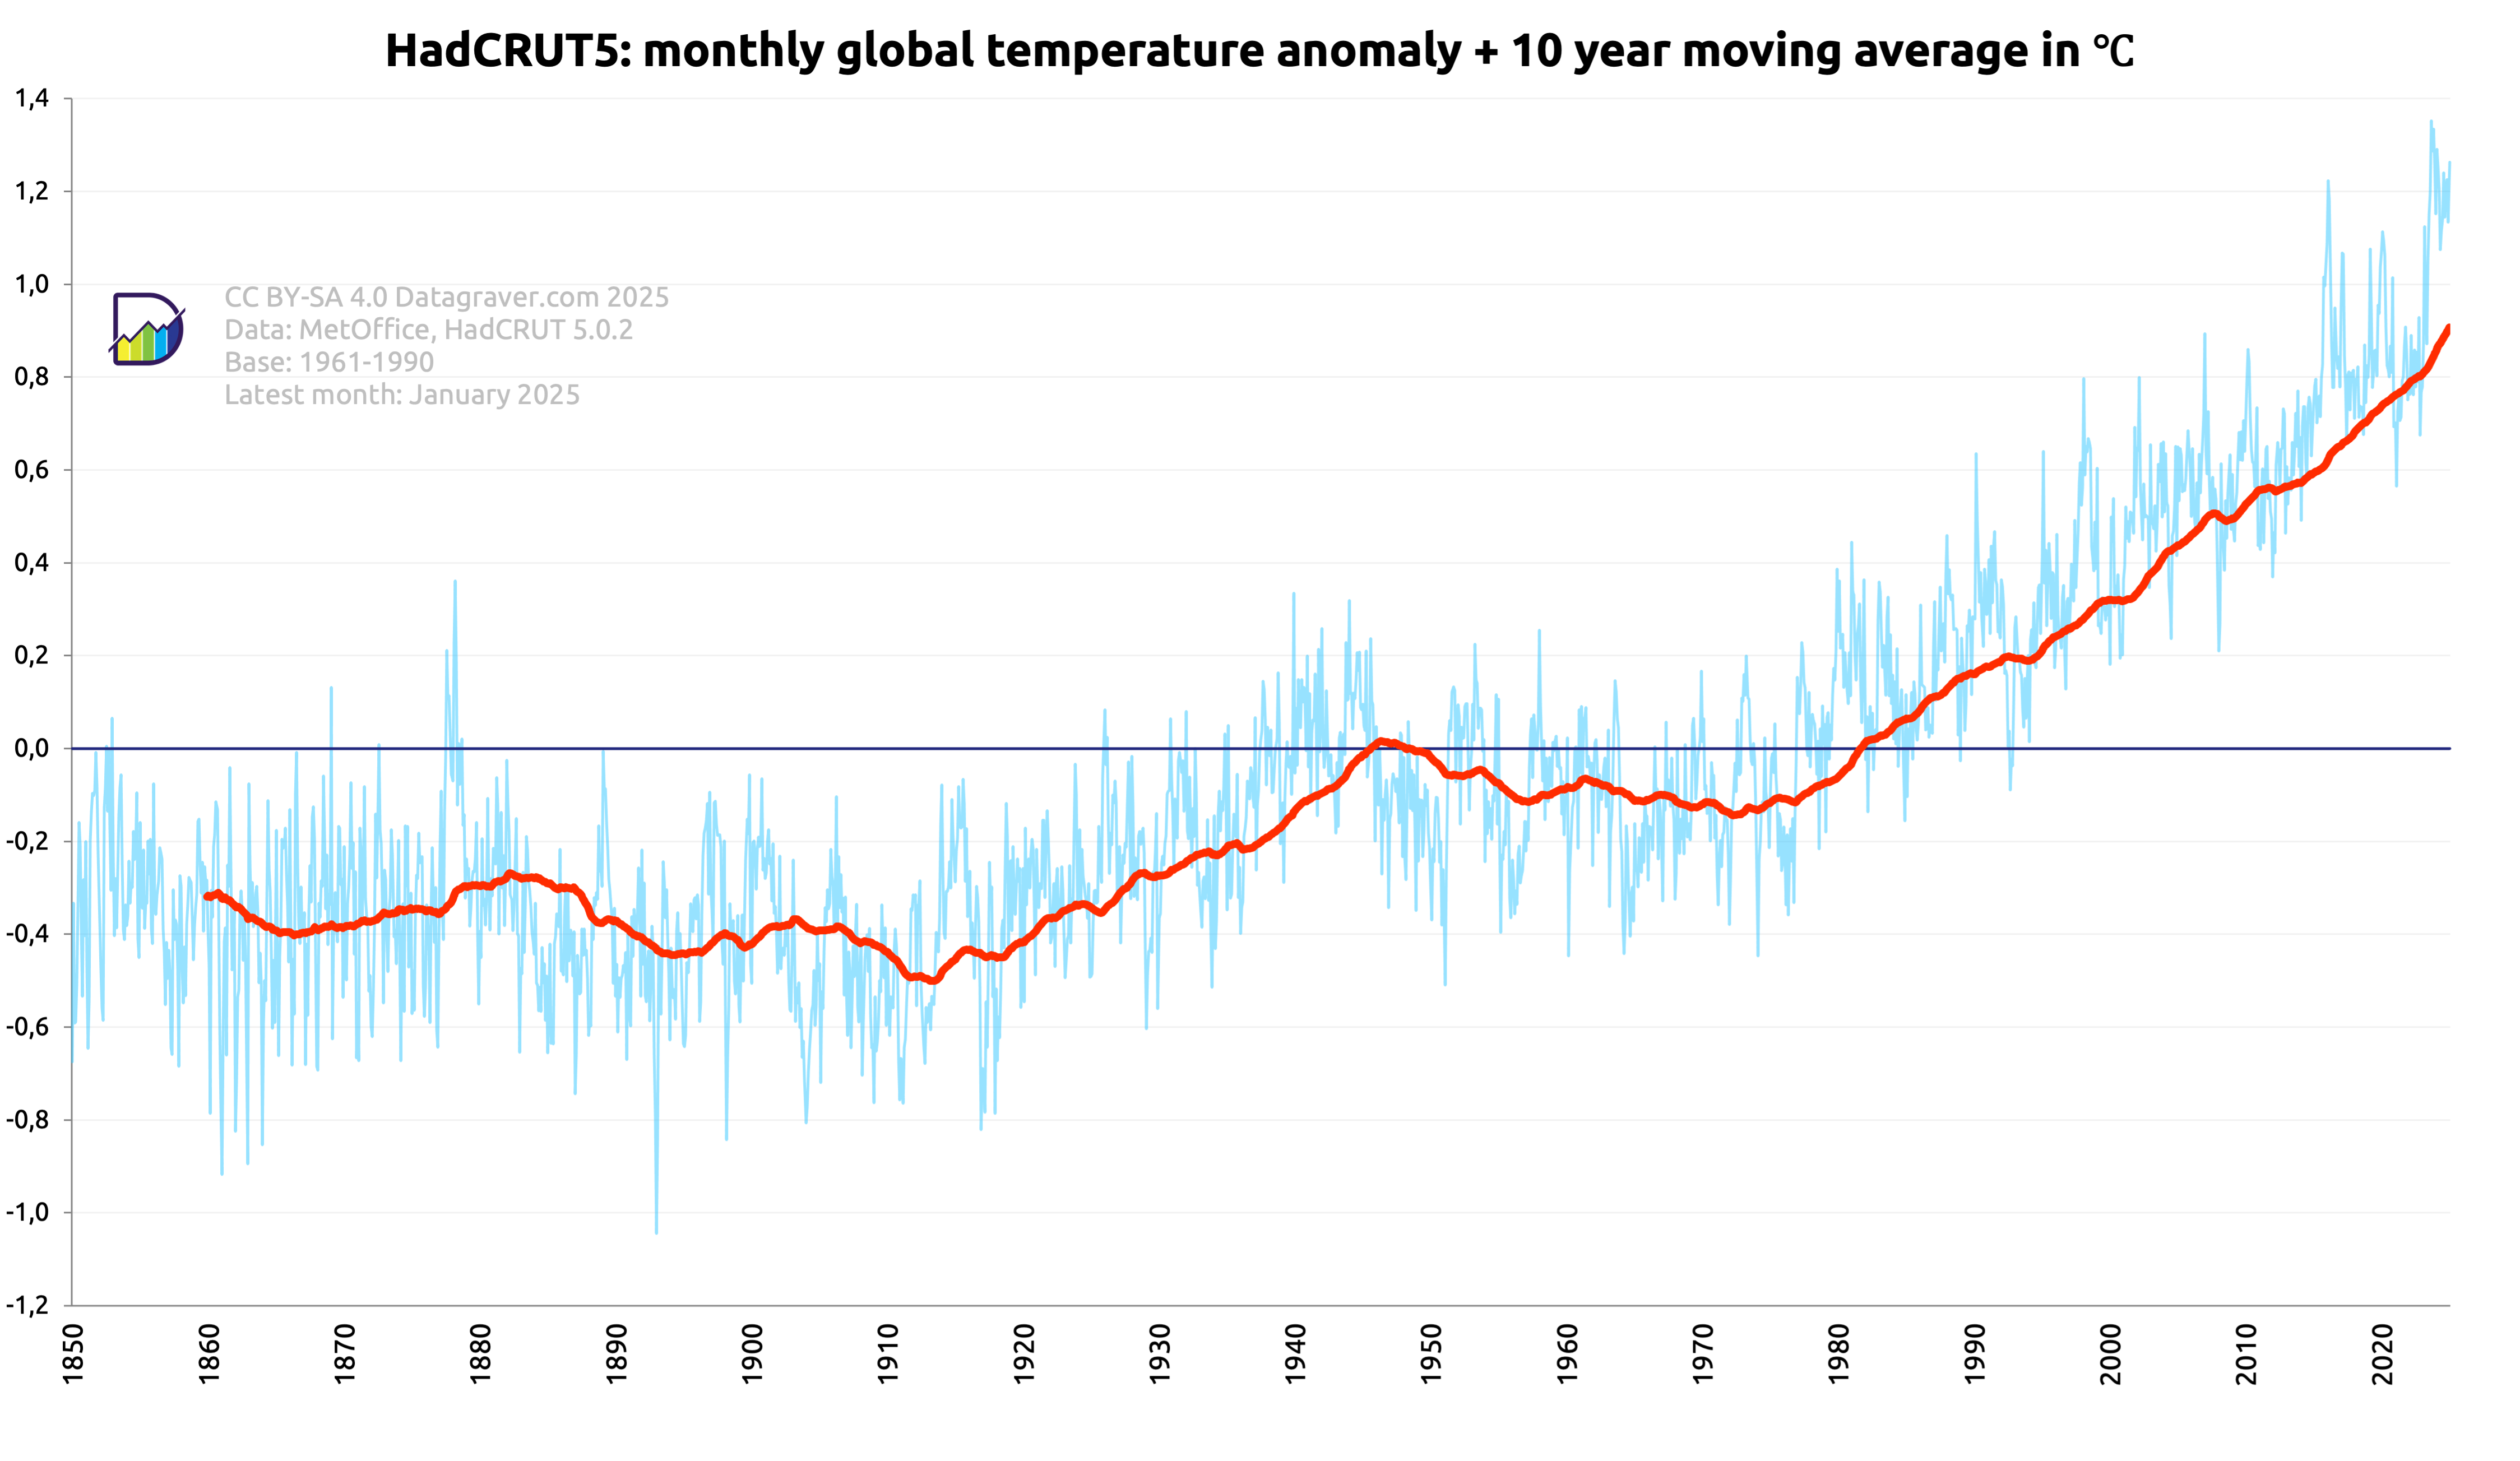
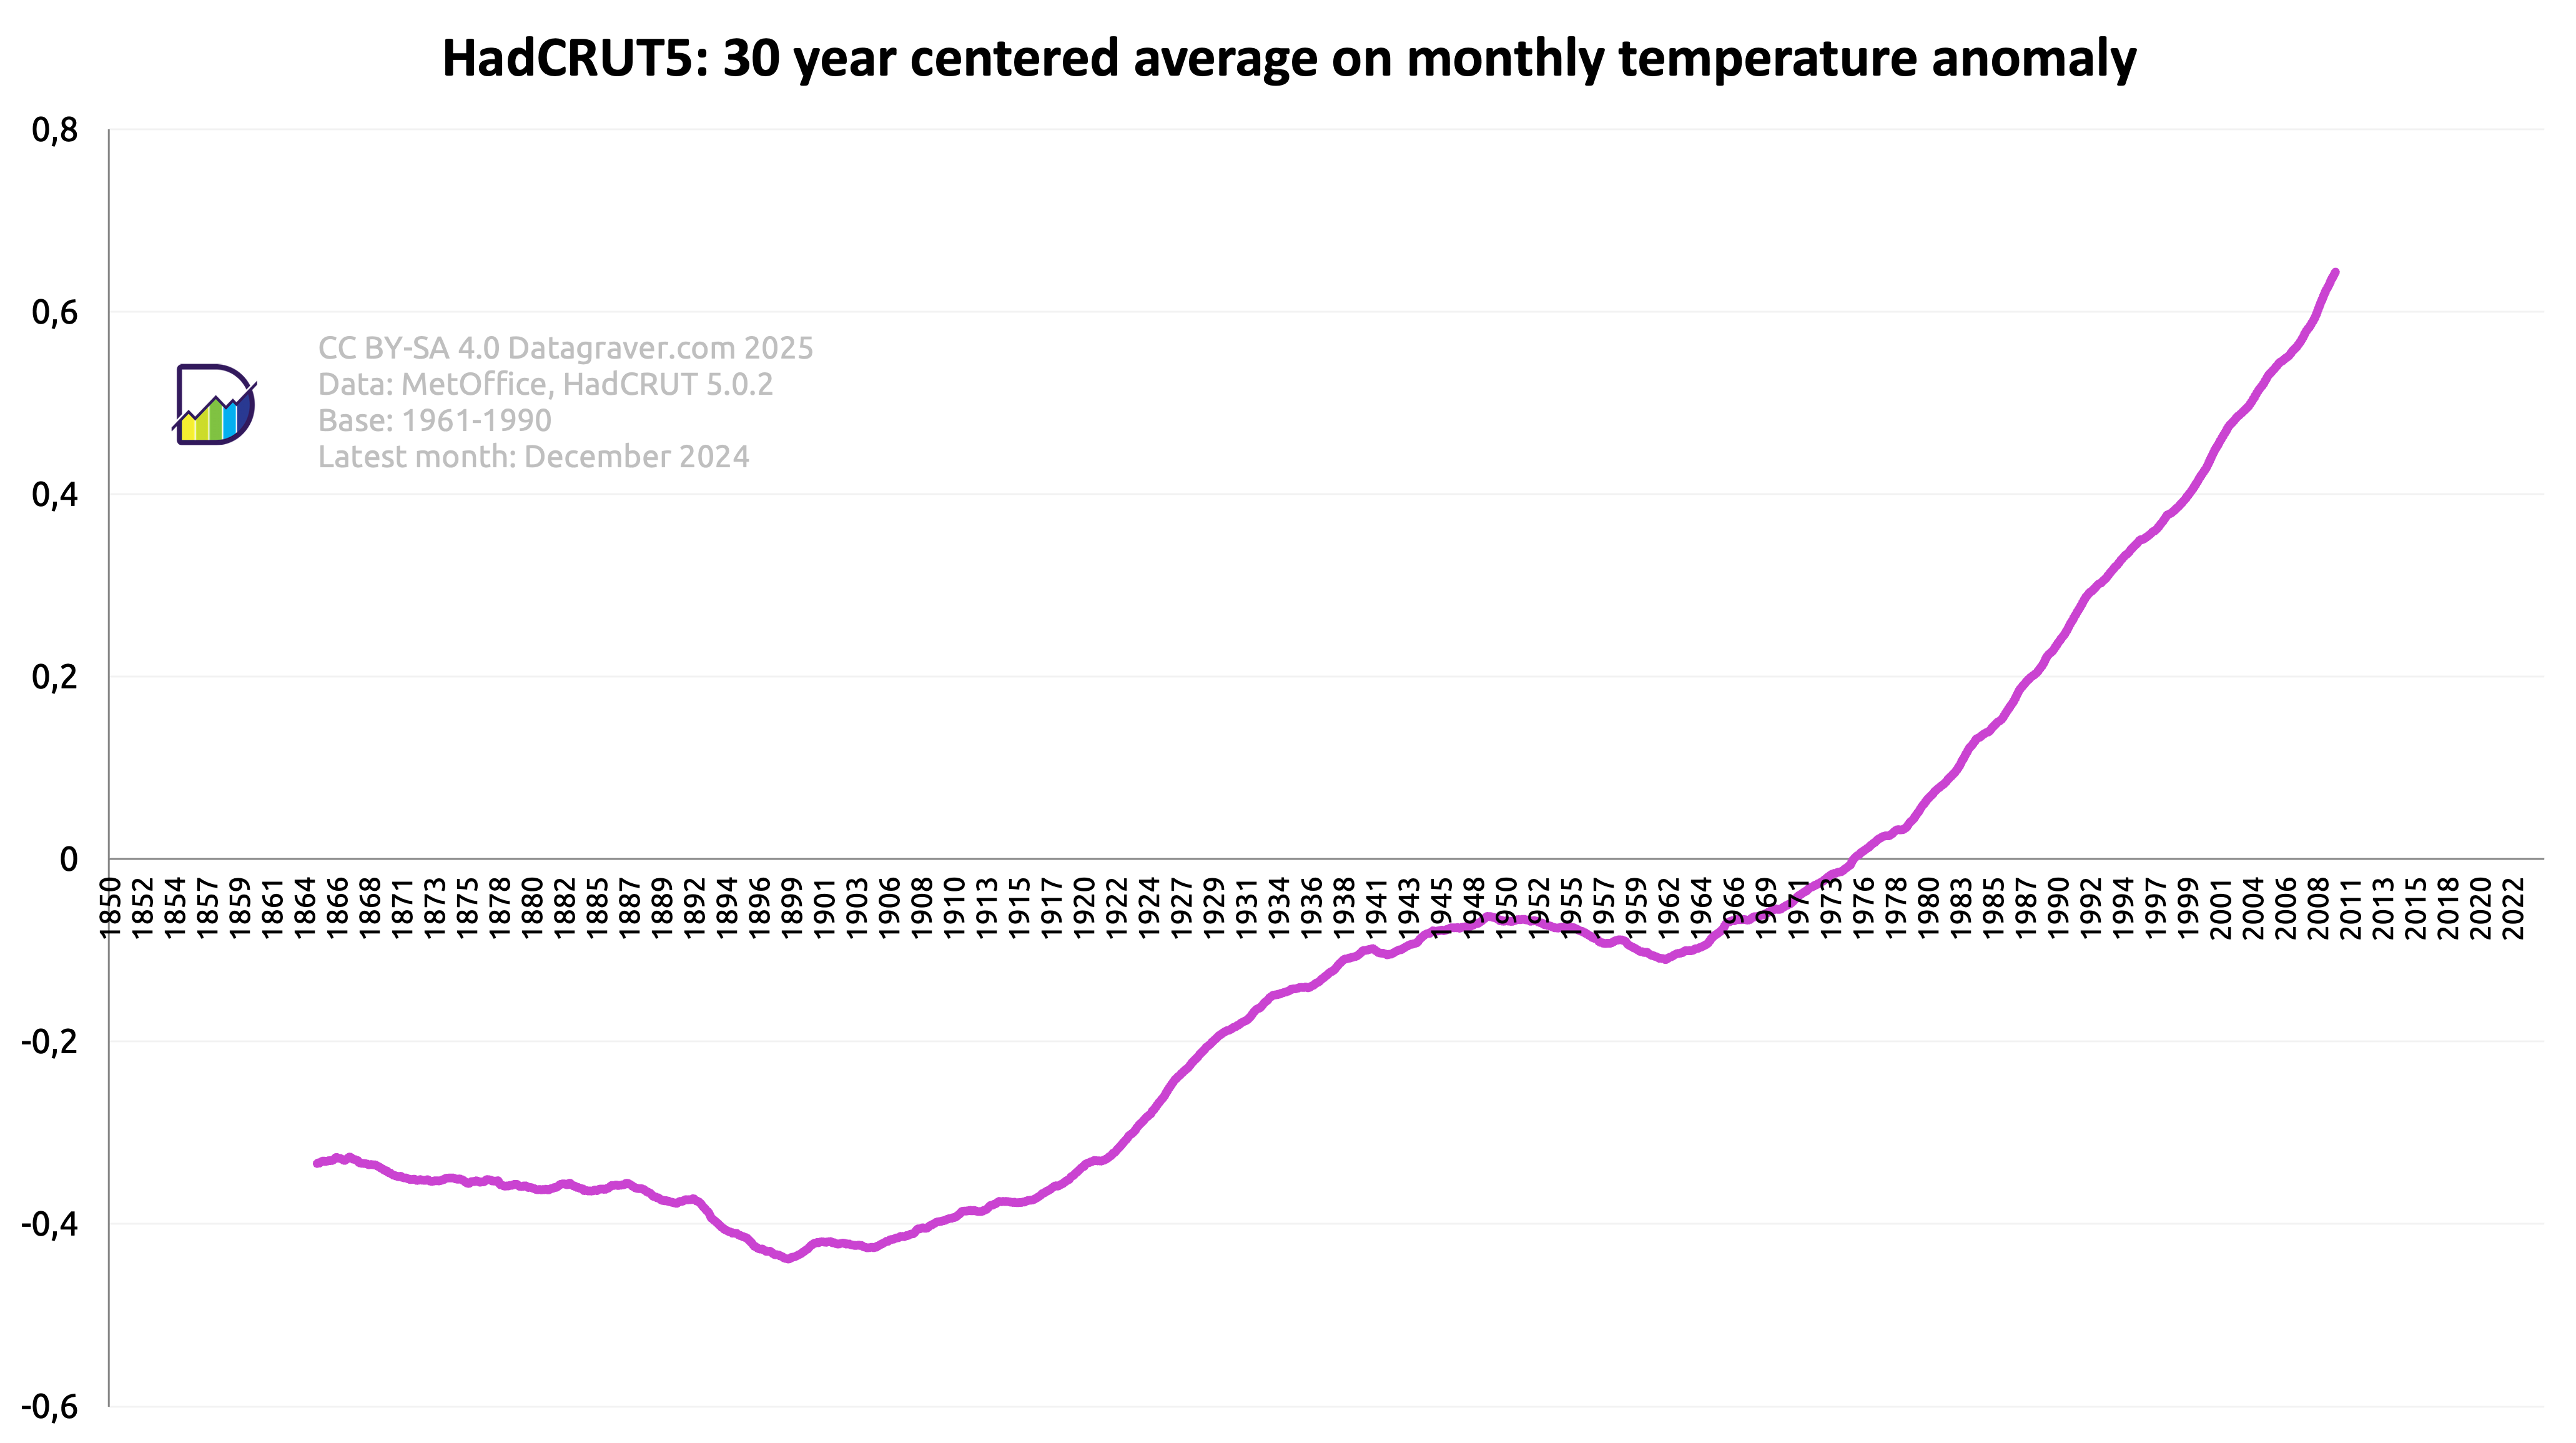
Here graphs based on the HadCRUT 5.0.2 dataset created by the Met Office (UK).
Regular updates. Check date in graph.
First graph is on the monthly anomalies plus a moving 10 year average.

Then the yearly averages on the monthly anomalies.

And the centered 30 year average on the monthly anomalies.
