Op basis van data van Autoweek een animatie (gemaakt met Flourish) van de autoverkopen per merk sinds 1982.
Maand: oktober 2024
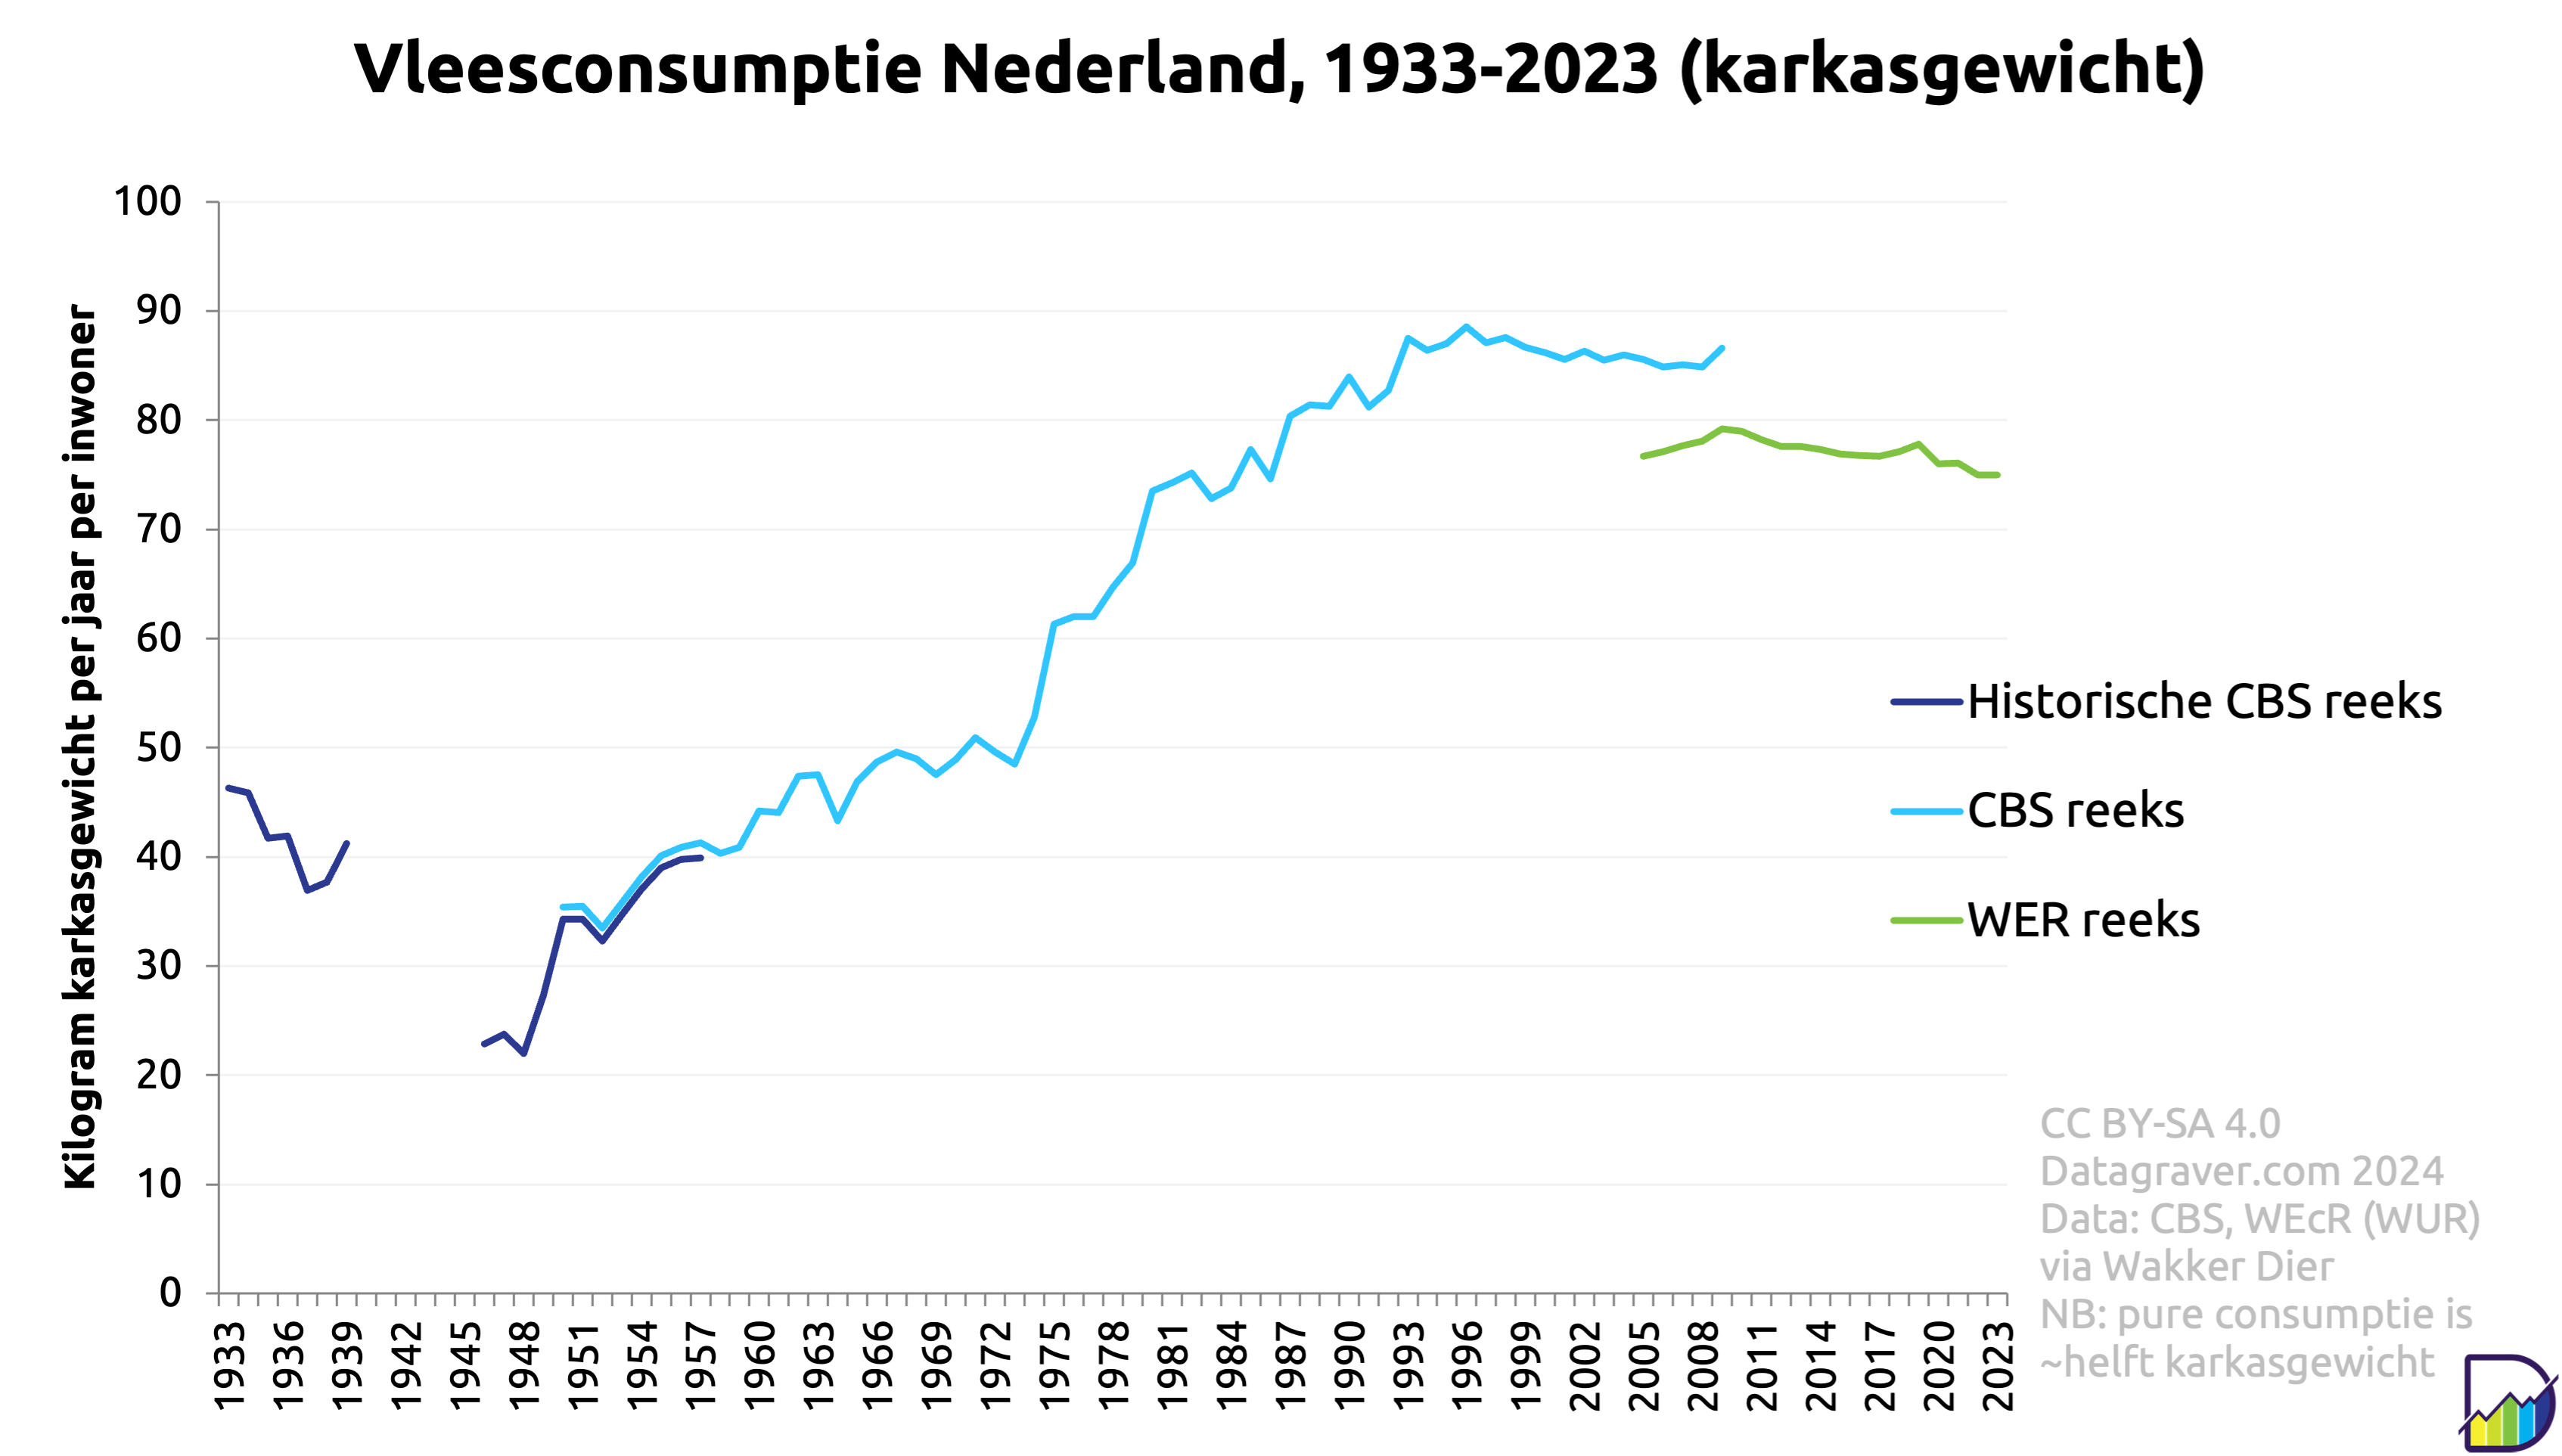
Vleesconsumptie Nederland
Trend in consumptie vlees door gemiddelde Nederlander, uitgedrukt in karkasgewicht (geslacht gewicht). Deel dat daadwerkelijk geconsumeerd wordt is grofweg de helft.
Data komt laatste jaren uit onderzoek van Wageningen Economic Research in opdracht van Wakker Dier.
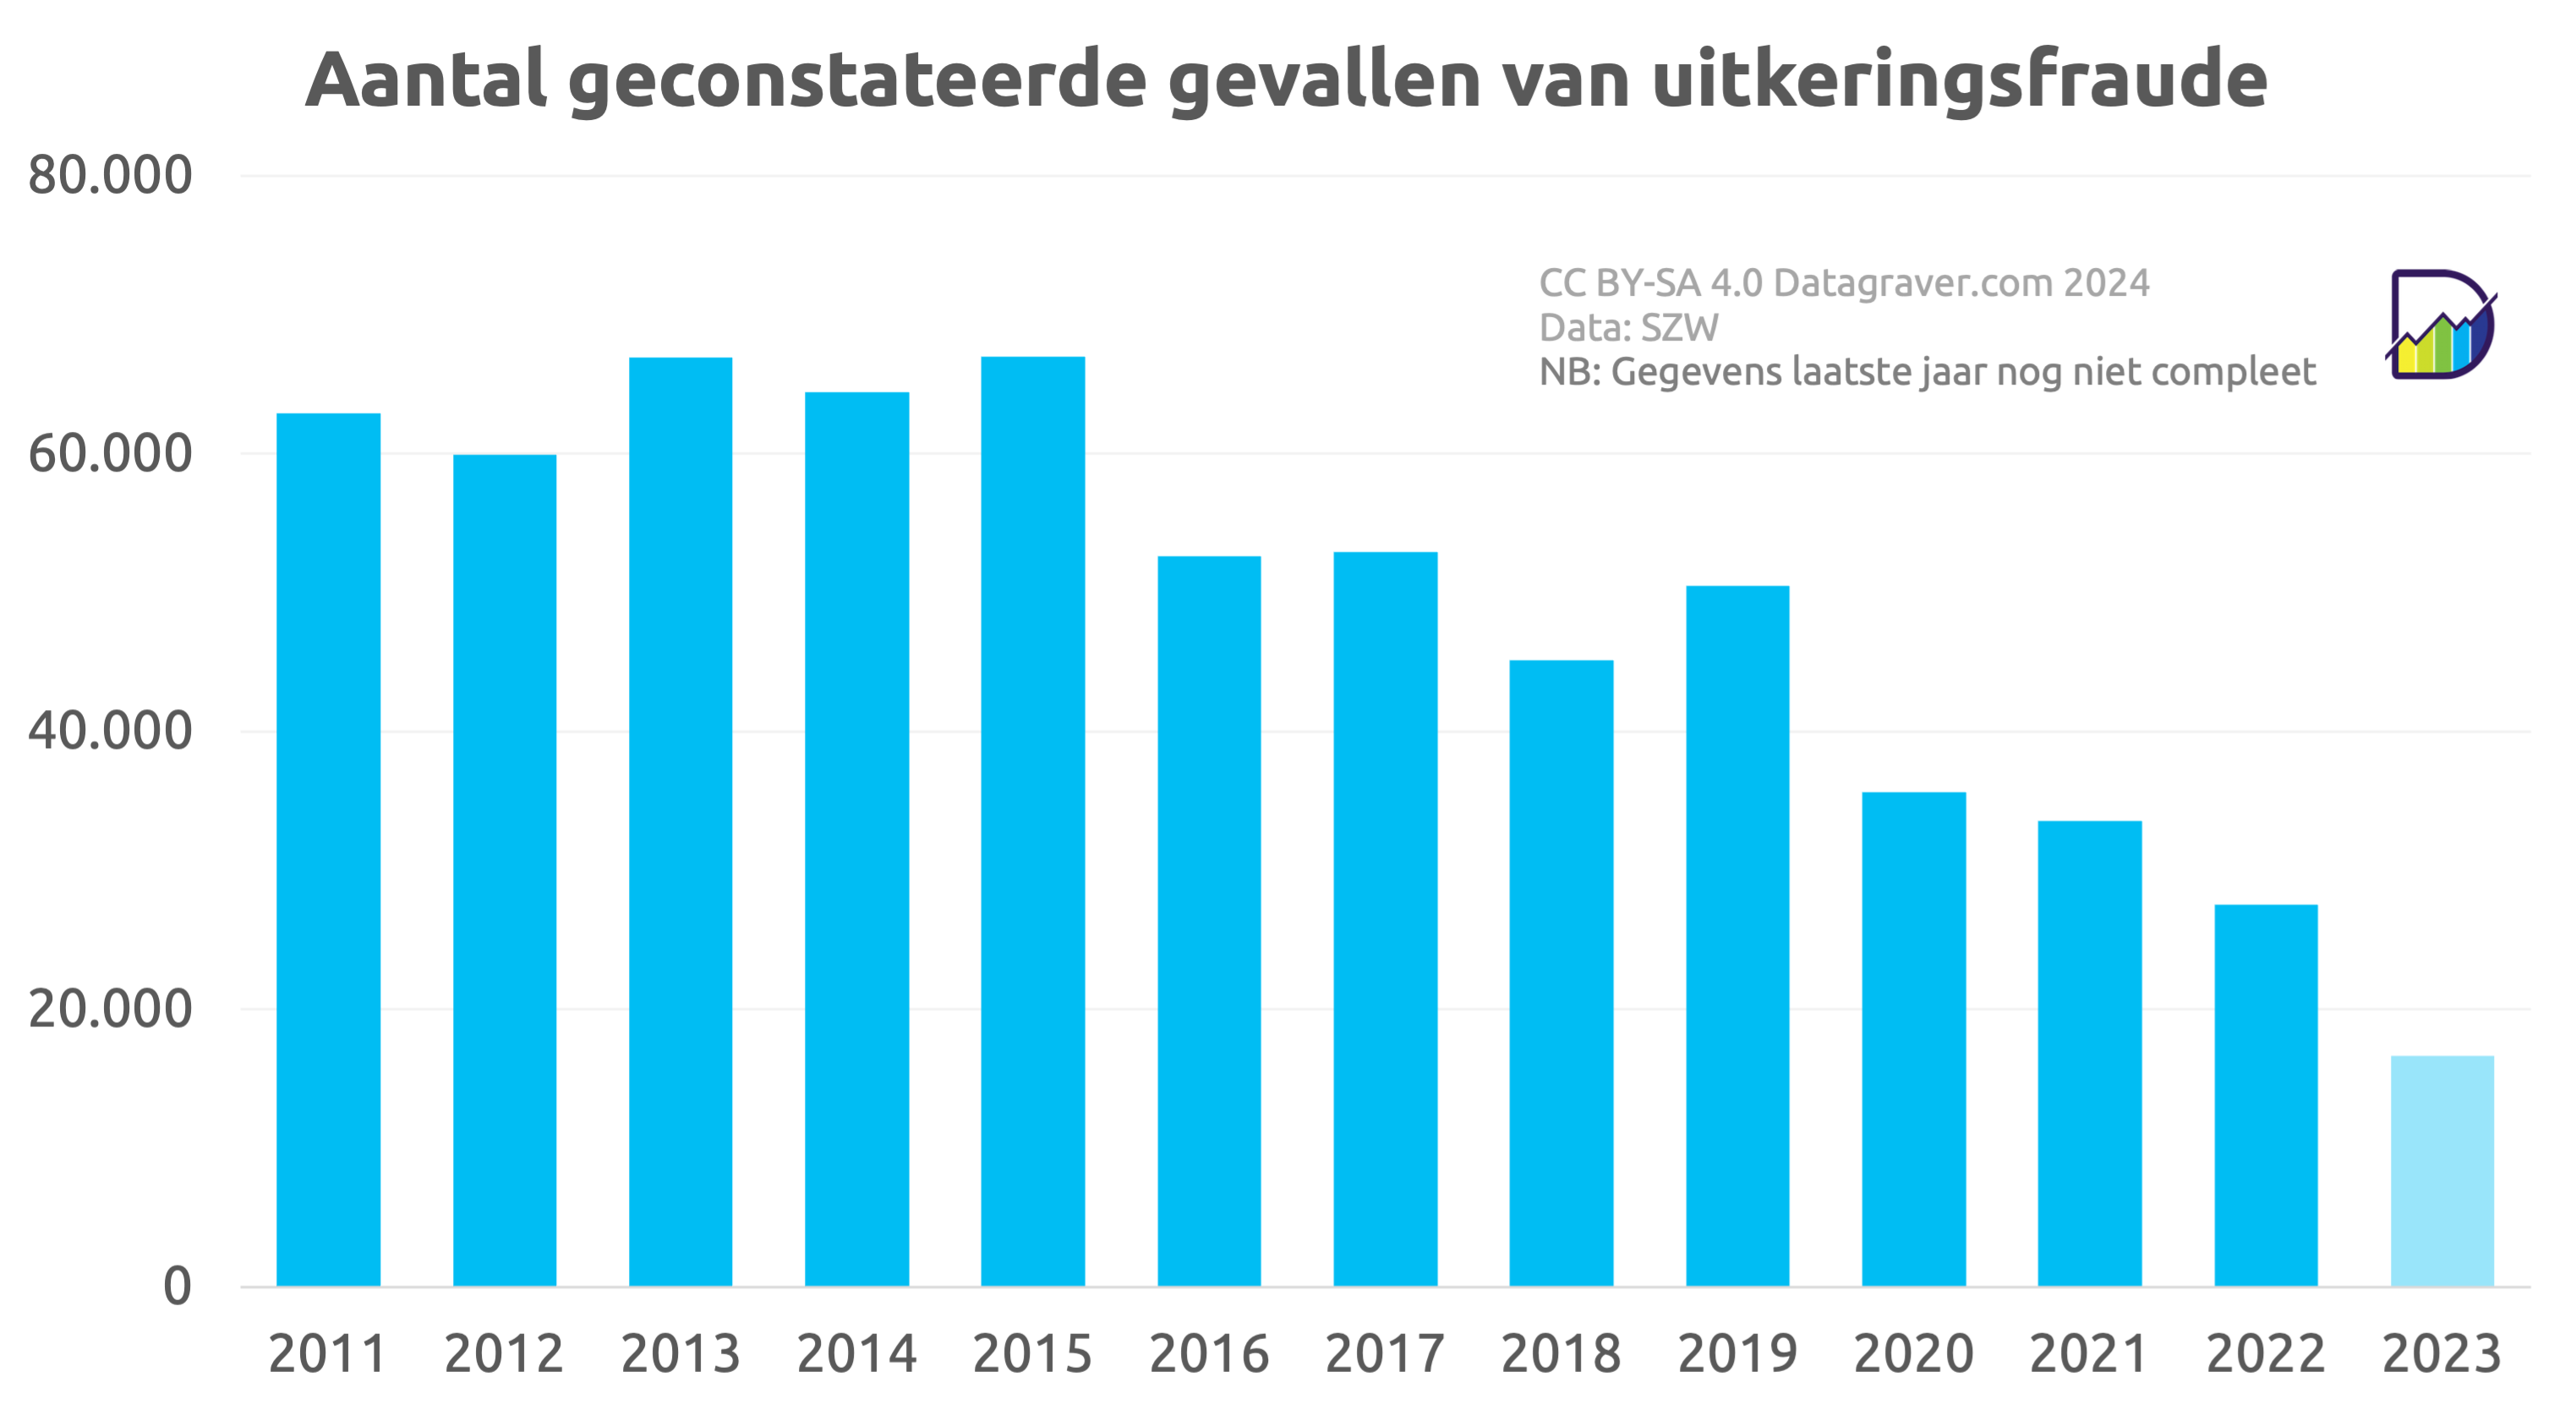
Fraude met uitkeringen
Het ministerie van SZW publiceert jaarlijks tijdens Prinsjesdag in haar stukken ook een overzicht van gevonden fraude op uitkeringen.
Aan de hand van die gegevens zijn onderstaande overzichten gemaakt.
NB: de gegevens van het laatst gemelde jaar zijn nog niet compleet. Rapportage over participatiewet loopt achter. Meestal zijn definitieve cijfers aantallen en totaal daarmee uiteindelijk 30% hoger.