US presidential election voting

Data on voter turn out and number of votes per candidate in US presidential elections since 1932.

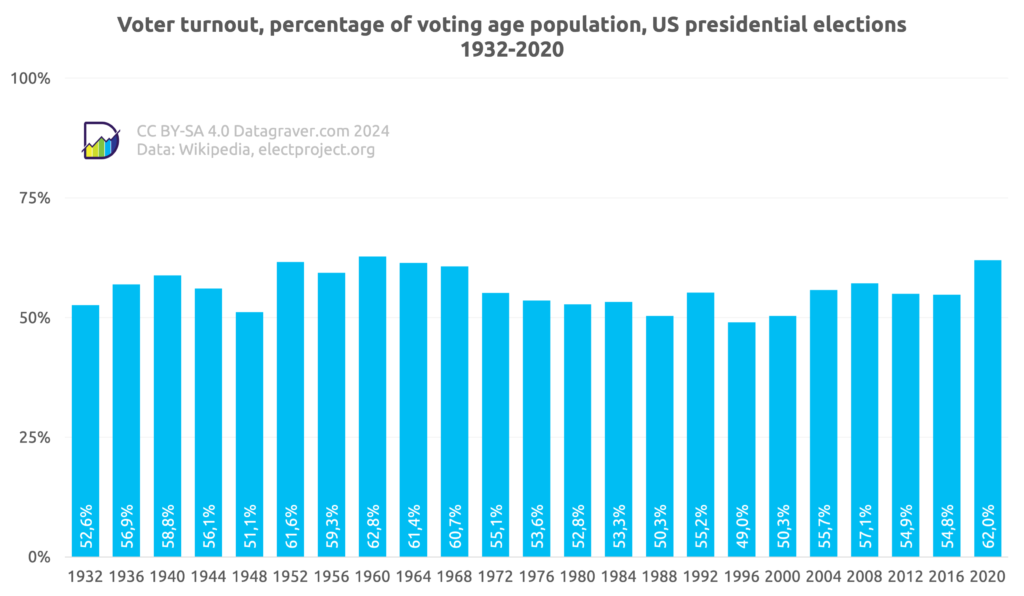
First the voter turnout as percentage of population with voting age.

Graph showing voter turnout as percentage of voting age population, for US presidential elections since 1932	
Data:	
Year	Percentage
1932	53%
1936	57%
1940	59%
1944	56%
1948	51%
1952	62%
1956	59%
1960	63%
1964	61%
1968	61%
1972	55%
1976	54%
1980	53%
1984	53%
1988	50%
1992	55%
1996	49%
2000	50%
2004	56%
2008	57%
2012	55%
2016	55%
2020	62%

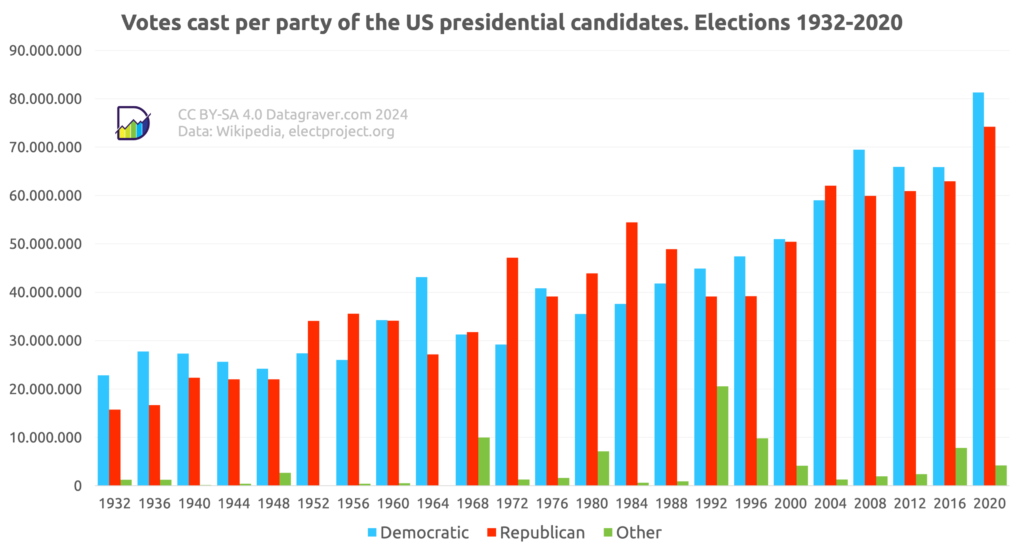
Number of votes per candidate per election.

Graph showing votes cast per party of the presidential candidates in US elections since 1932.			
Data:			
Year	Democratic	Republican	Other
1932	22821277	15761254	1234469
1936	27747636	16679543	1219821
1940	27313945	22347744	153311
1944	25612916	22017929	395155
1948	24179347	21991292	2663361
1952	27375090	34075529	101381
1956	26028028	35579180	419792
1960	34220984	34108157	506859
1964	43127041	27175754	
1968	31271839	31783783	9971378
1972	29173222	47168710	1283068
1976	40831881	39148634	1622485
1980	35480115	43903230	7113655
1984	37577352	54455472	622176
1988	41809074	48886097	891829
1992	44909806	39104550	20585644
1996	47401185	39197469	9791346
2000	50999897	50456002	4138101
2004	59028444	62040610	1279946
2008	69498516	59948323	1960161
2012	65915795	60933504	2385701
2016	65844610	62979636	7845030
2020	81283501	74223975	4182981

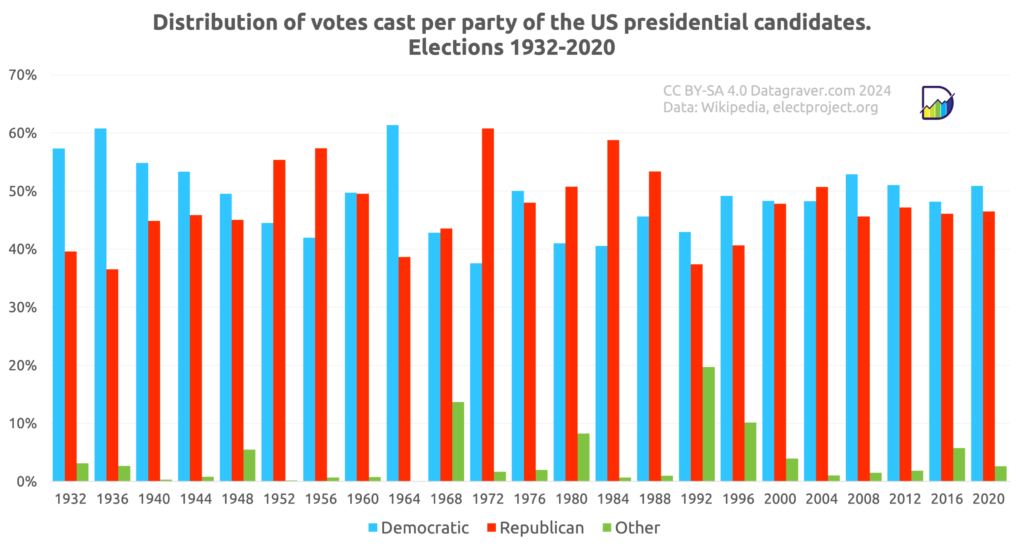
And the distribution of votes per candidate per election.

Graph showing distribution of votes cast per party of the presidential candidates in US elections since 1932.			
Data:			
Year	Democratic	Republican	Other
1932	57%	40%	3%
1936	61%	37%	3%
1940	55%	45%	0%
1944	53%	46%	1%
1948	50%	45%	5%
1952	44%	55%	0%
1956	42%	57%	1%
1960	50%	50%	1%
1964	61%	39%	0%
1968	43%	44%	14%
1972	38%	61%	2%
1976	50%	48%	2%
1980	41%	51%	8%
1984	41%	59%	1%
1988	46%	53%	1%
1992	43%	37%	20%
1996	49%	41%	10%
2000	48%	48%	4%
2004	48%	51%	1%
2008	53%	46%	1%
2012	51%	47%	2%
2016	48%	46%	6%
2020	51%	46%	3%