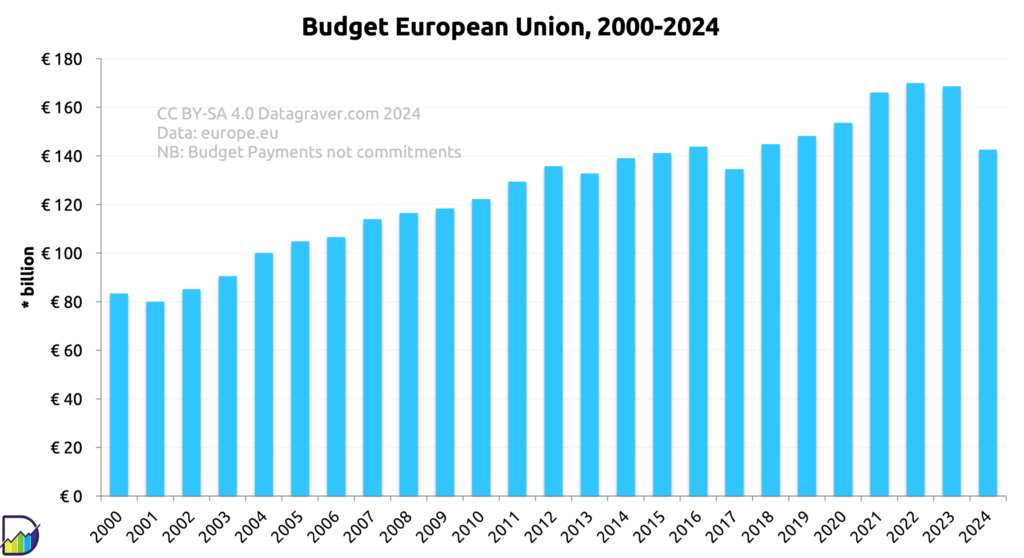
Overview of the EU budget for each year from 2000 onward. This concerns the Payments part of the budget.
Digging data
Posts about things in the world, in English.
Overview of the EU budget for each year from 2000 onward. This concerns the Payments part of the budget.
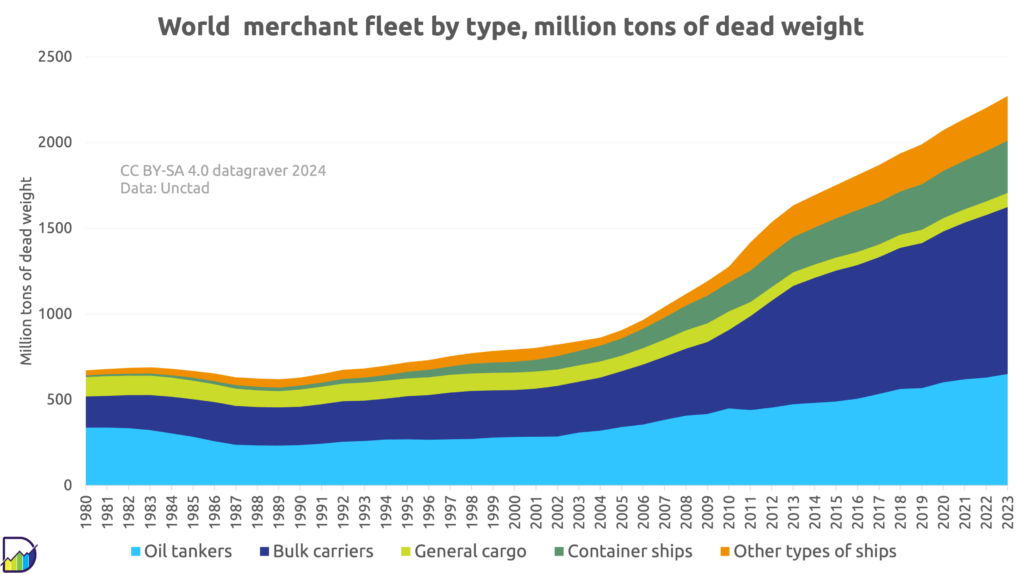
Overview of size of world merchant fleet, in millions of tons dead weight, since 1980. Based on Unctad data.
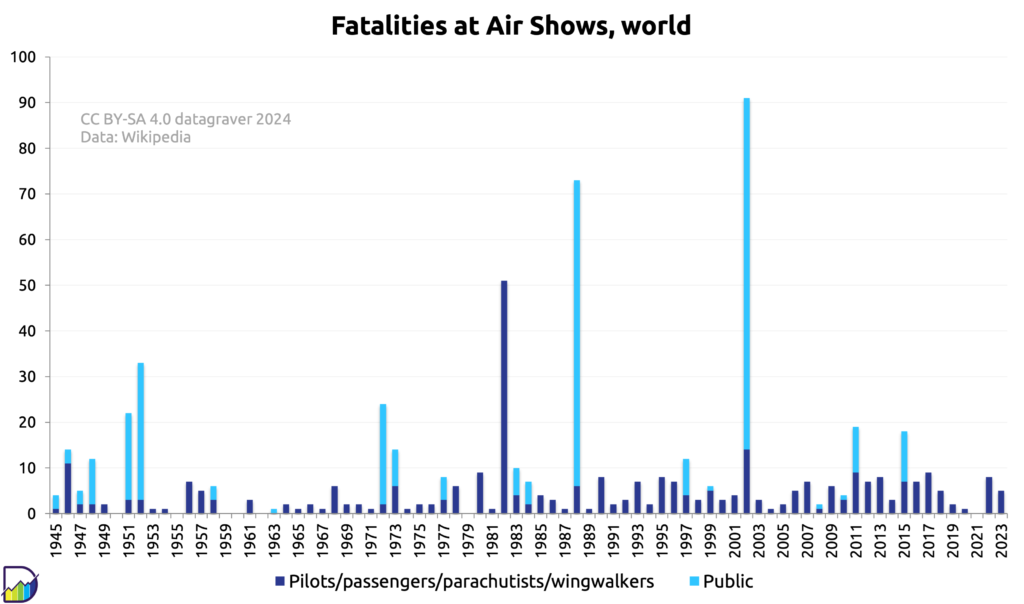
Number of fatalities, participants and public, at Air Shows, per year since 1945.
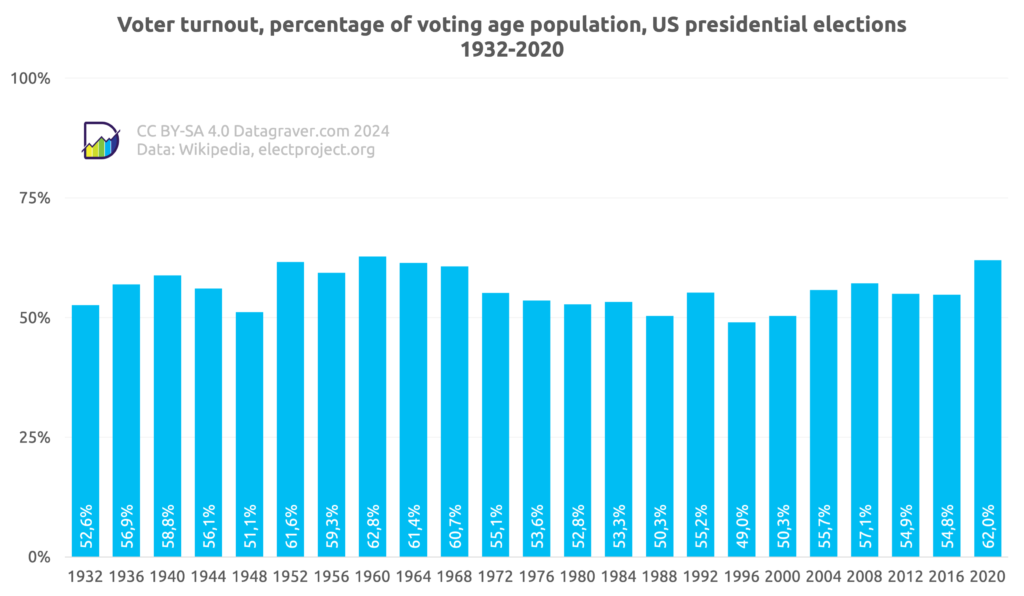
Data on voter turn out and number of votes per candidate in US presidential elections since 1932.
First the voter turnout as percentage of population with voting age.
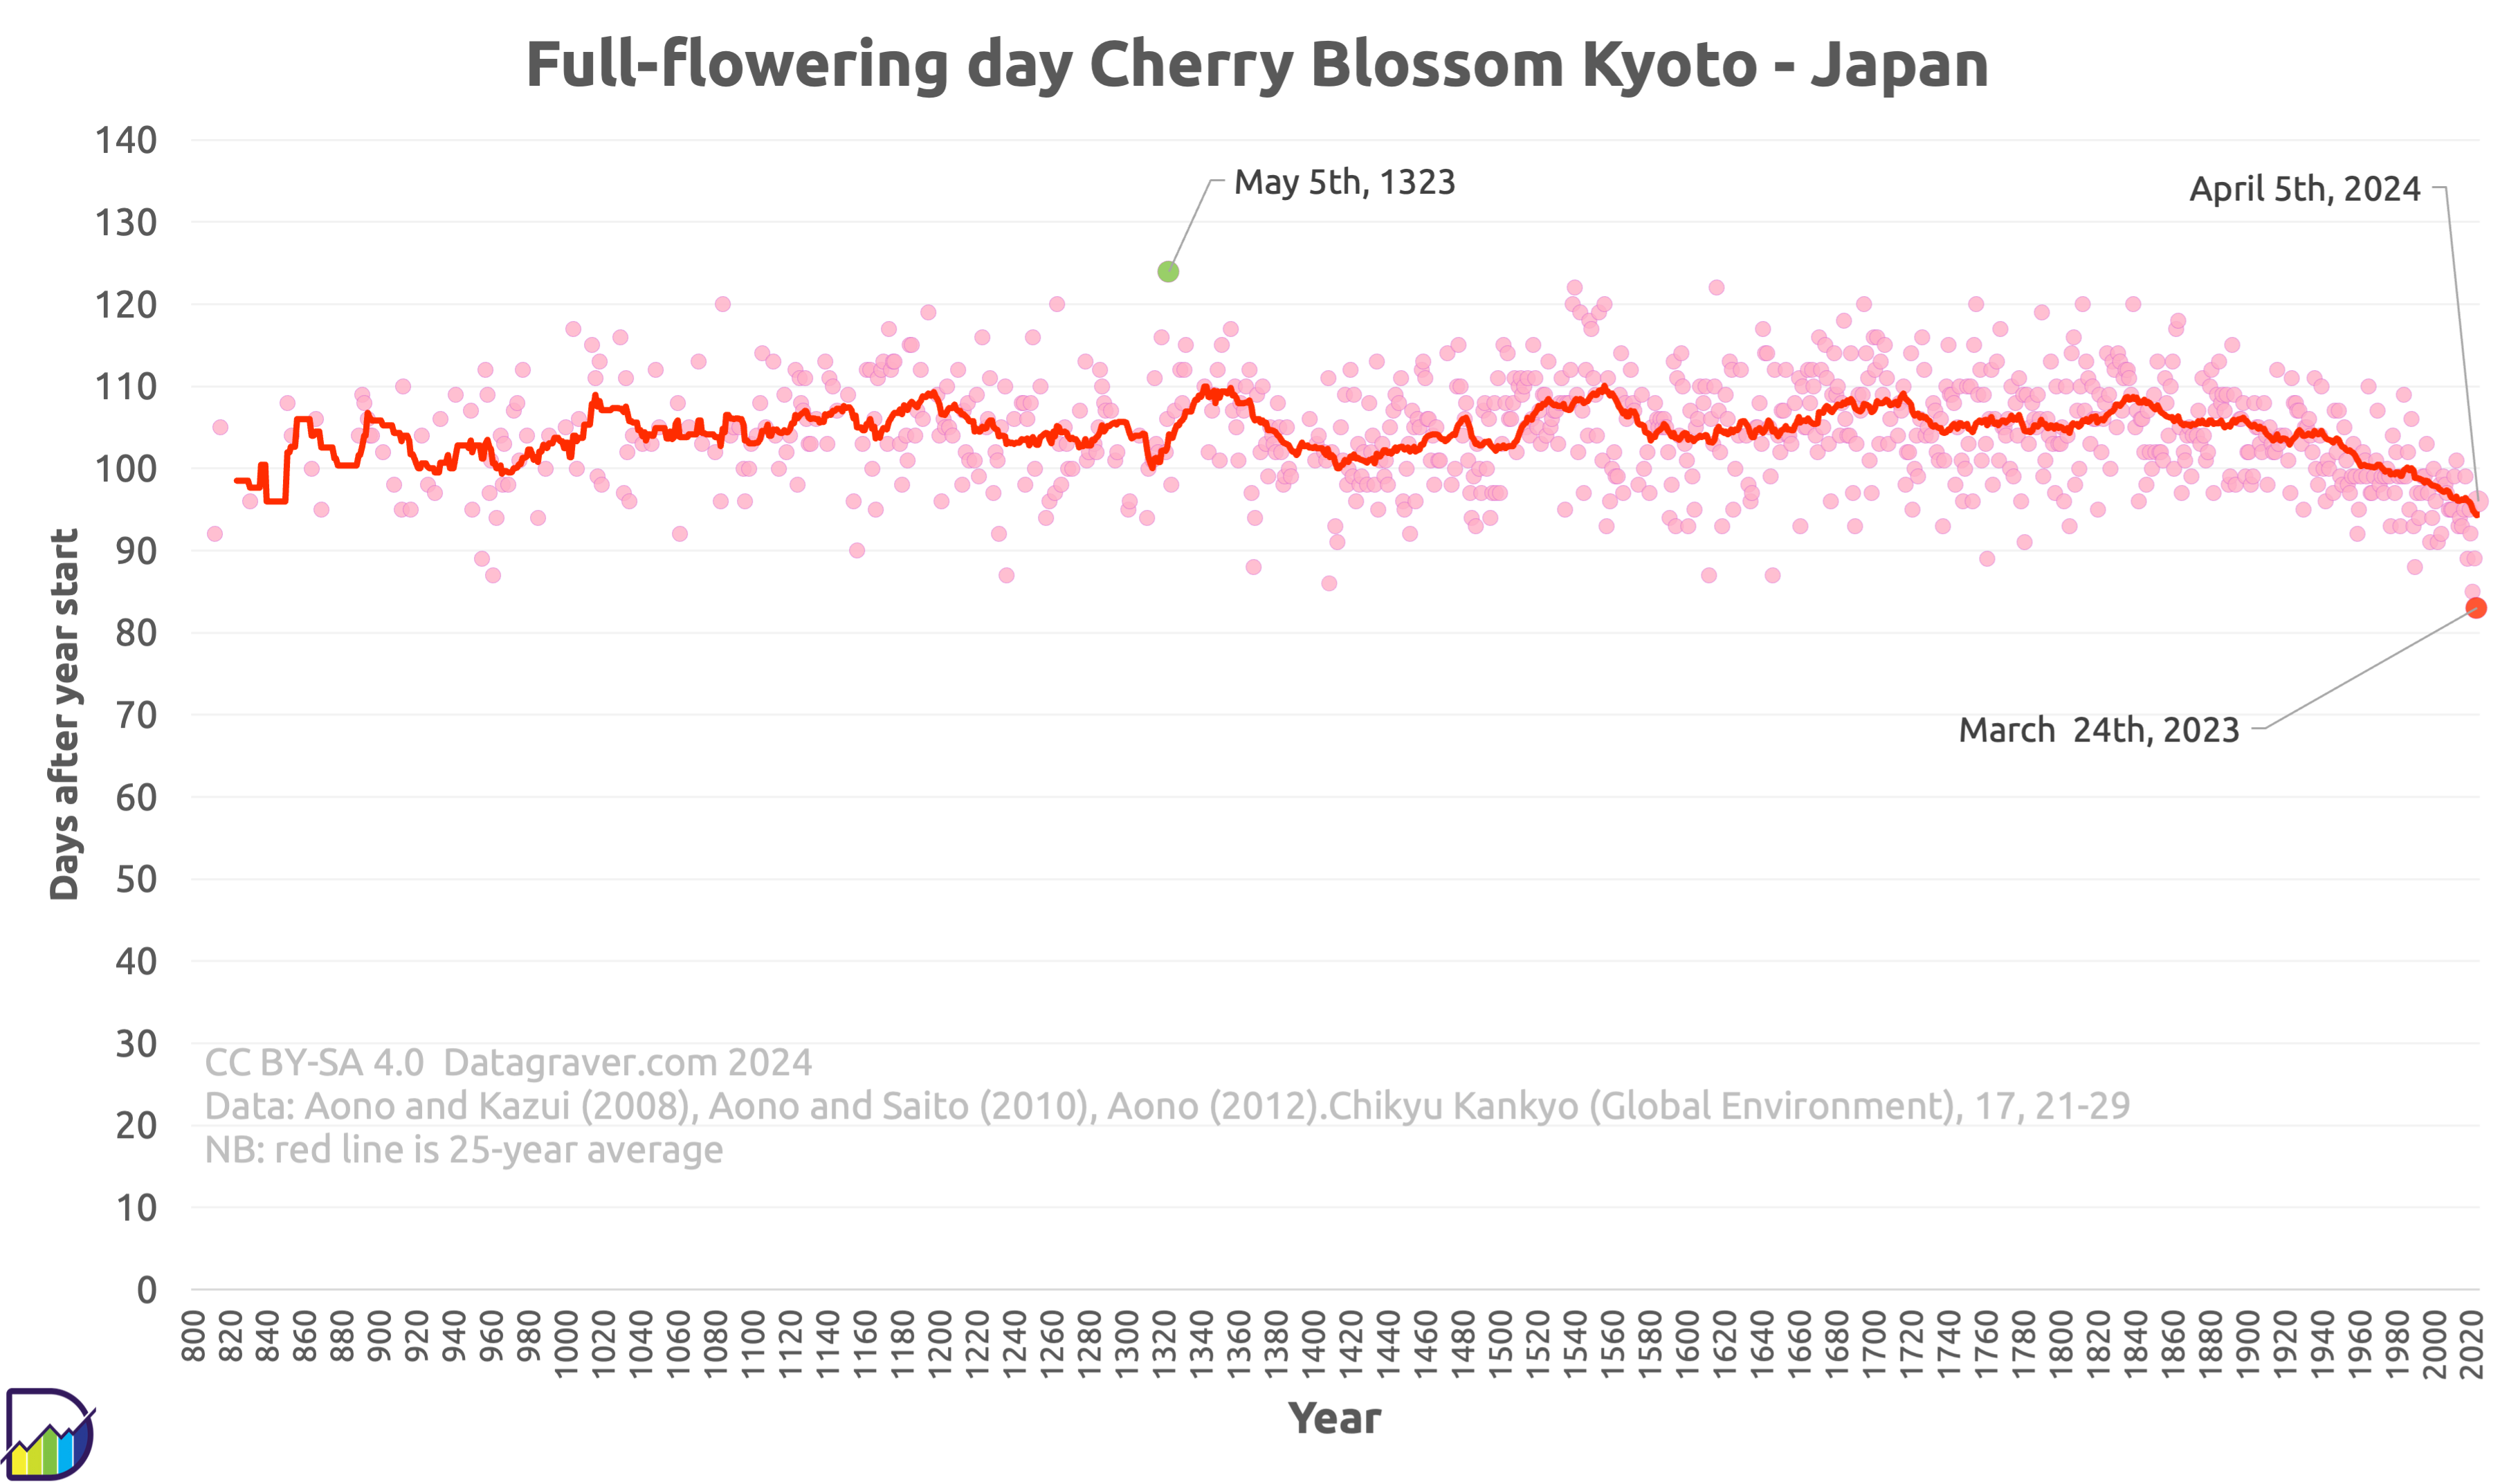
Based on the research done by Aono and Kazui in 2008, by Aono and Saito in 2010 and by Aono in 2012 the historic full flowering days since the year 812 for Kyoto in Japan where gathered.
Yearly we add the new dates and update the graph. The current version is up to date till 2023.
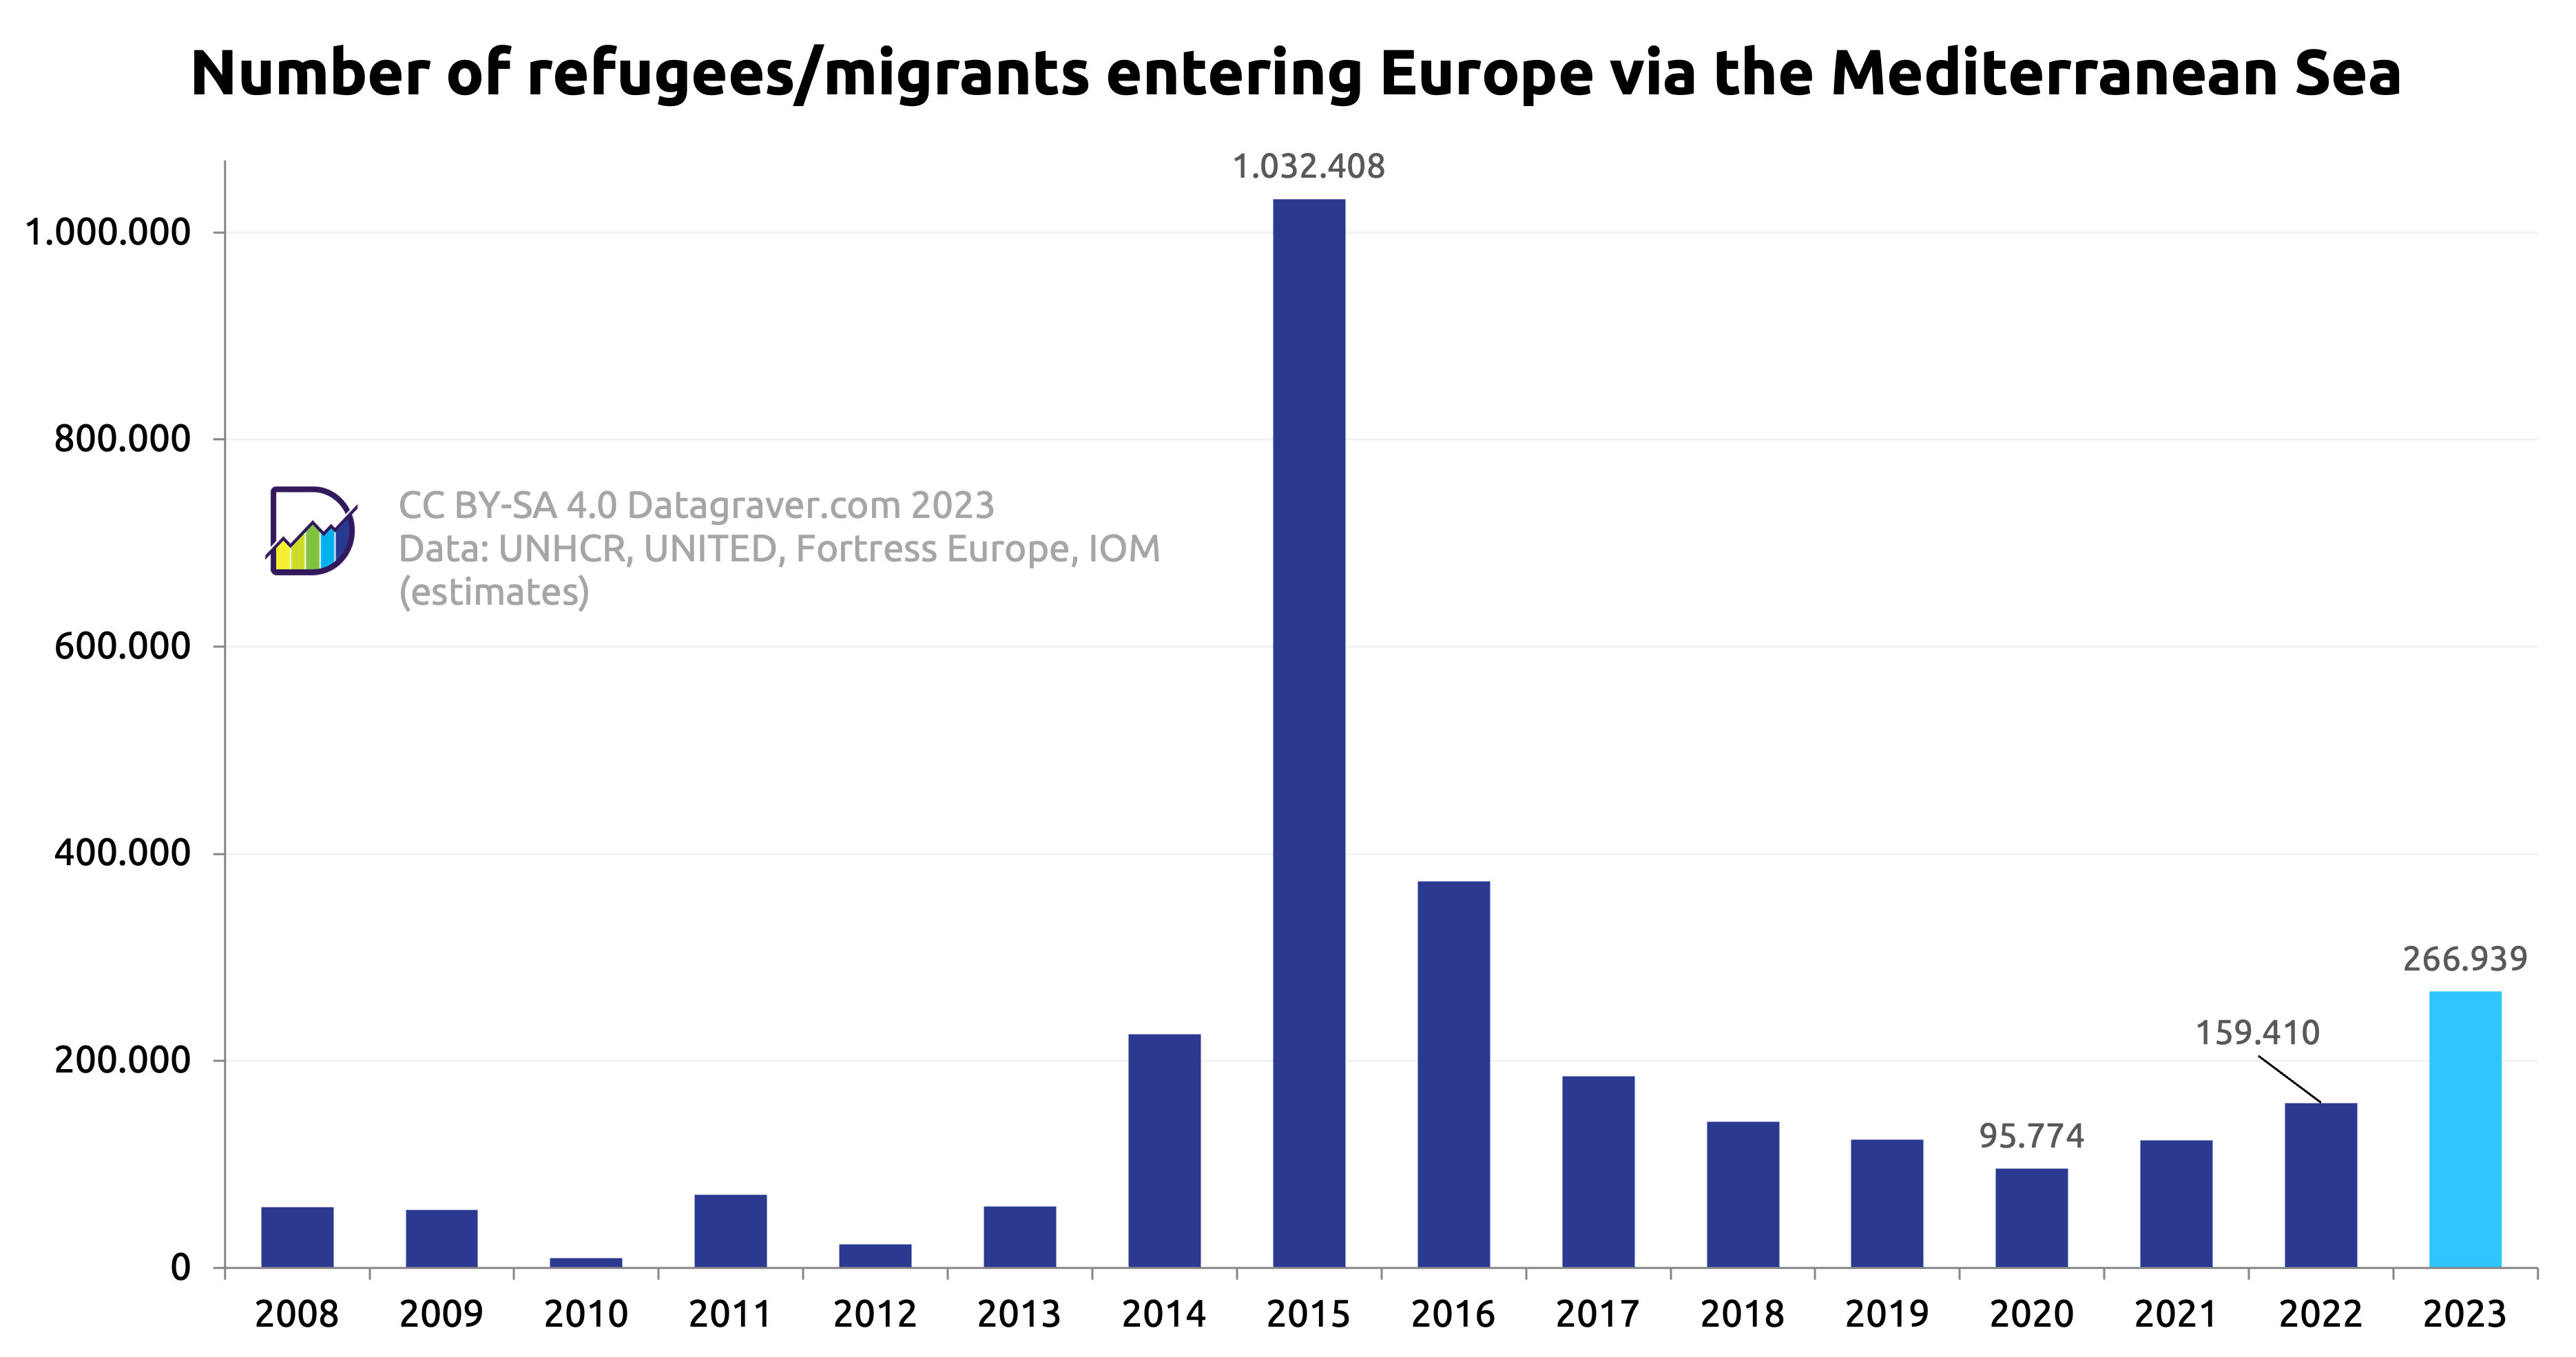
The UNHCR reports on the number of refugees and migrants entering Europe via the Mediterranean Sea. We place these number in historic context.
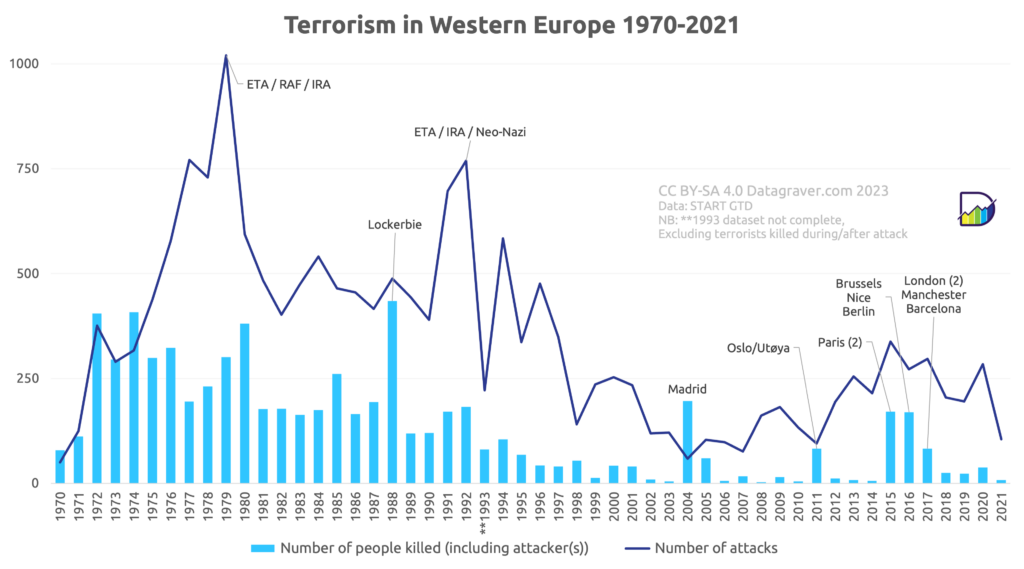
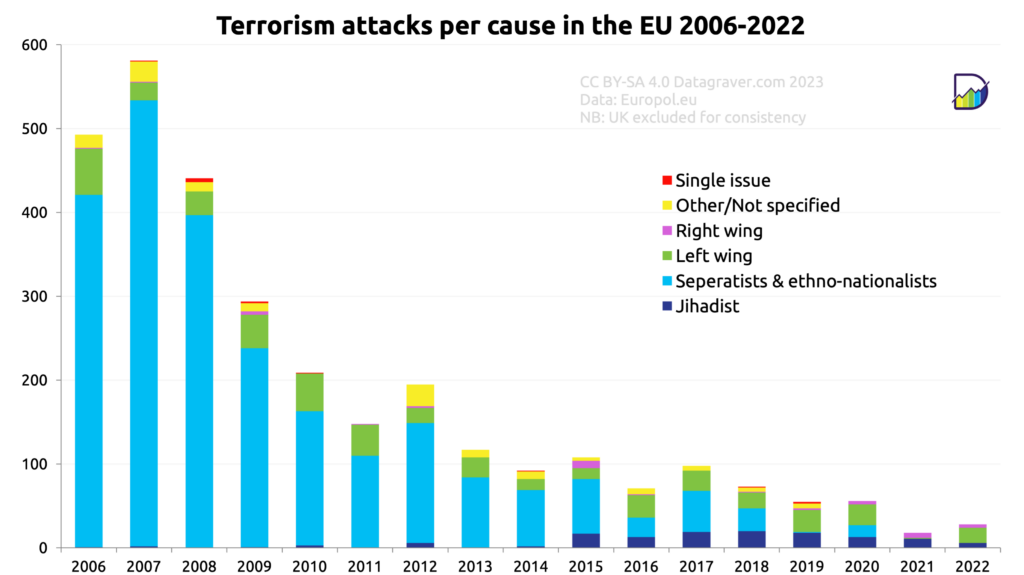
Each year Europol publishes a report on terrorism in the EU. We’ve gathered the data from all years available and created several graphs based on it.
Please not that in these graphs we have exclude the UK now, even for the years that they were still in the EU. this was done to make the data a bit more comparable over the years shown.
First a graph with a count of all attacks per year, split per cause (stacked bar chart).
Number of terrorism attacks and number of people killed in those attacks in Western Europe per year since 1970. Based on GTD data.