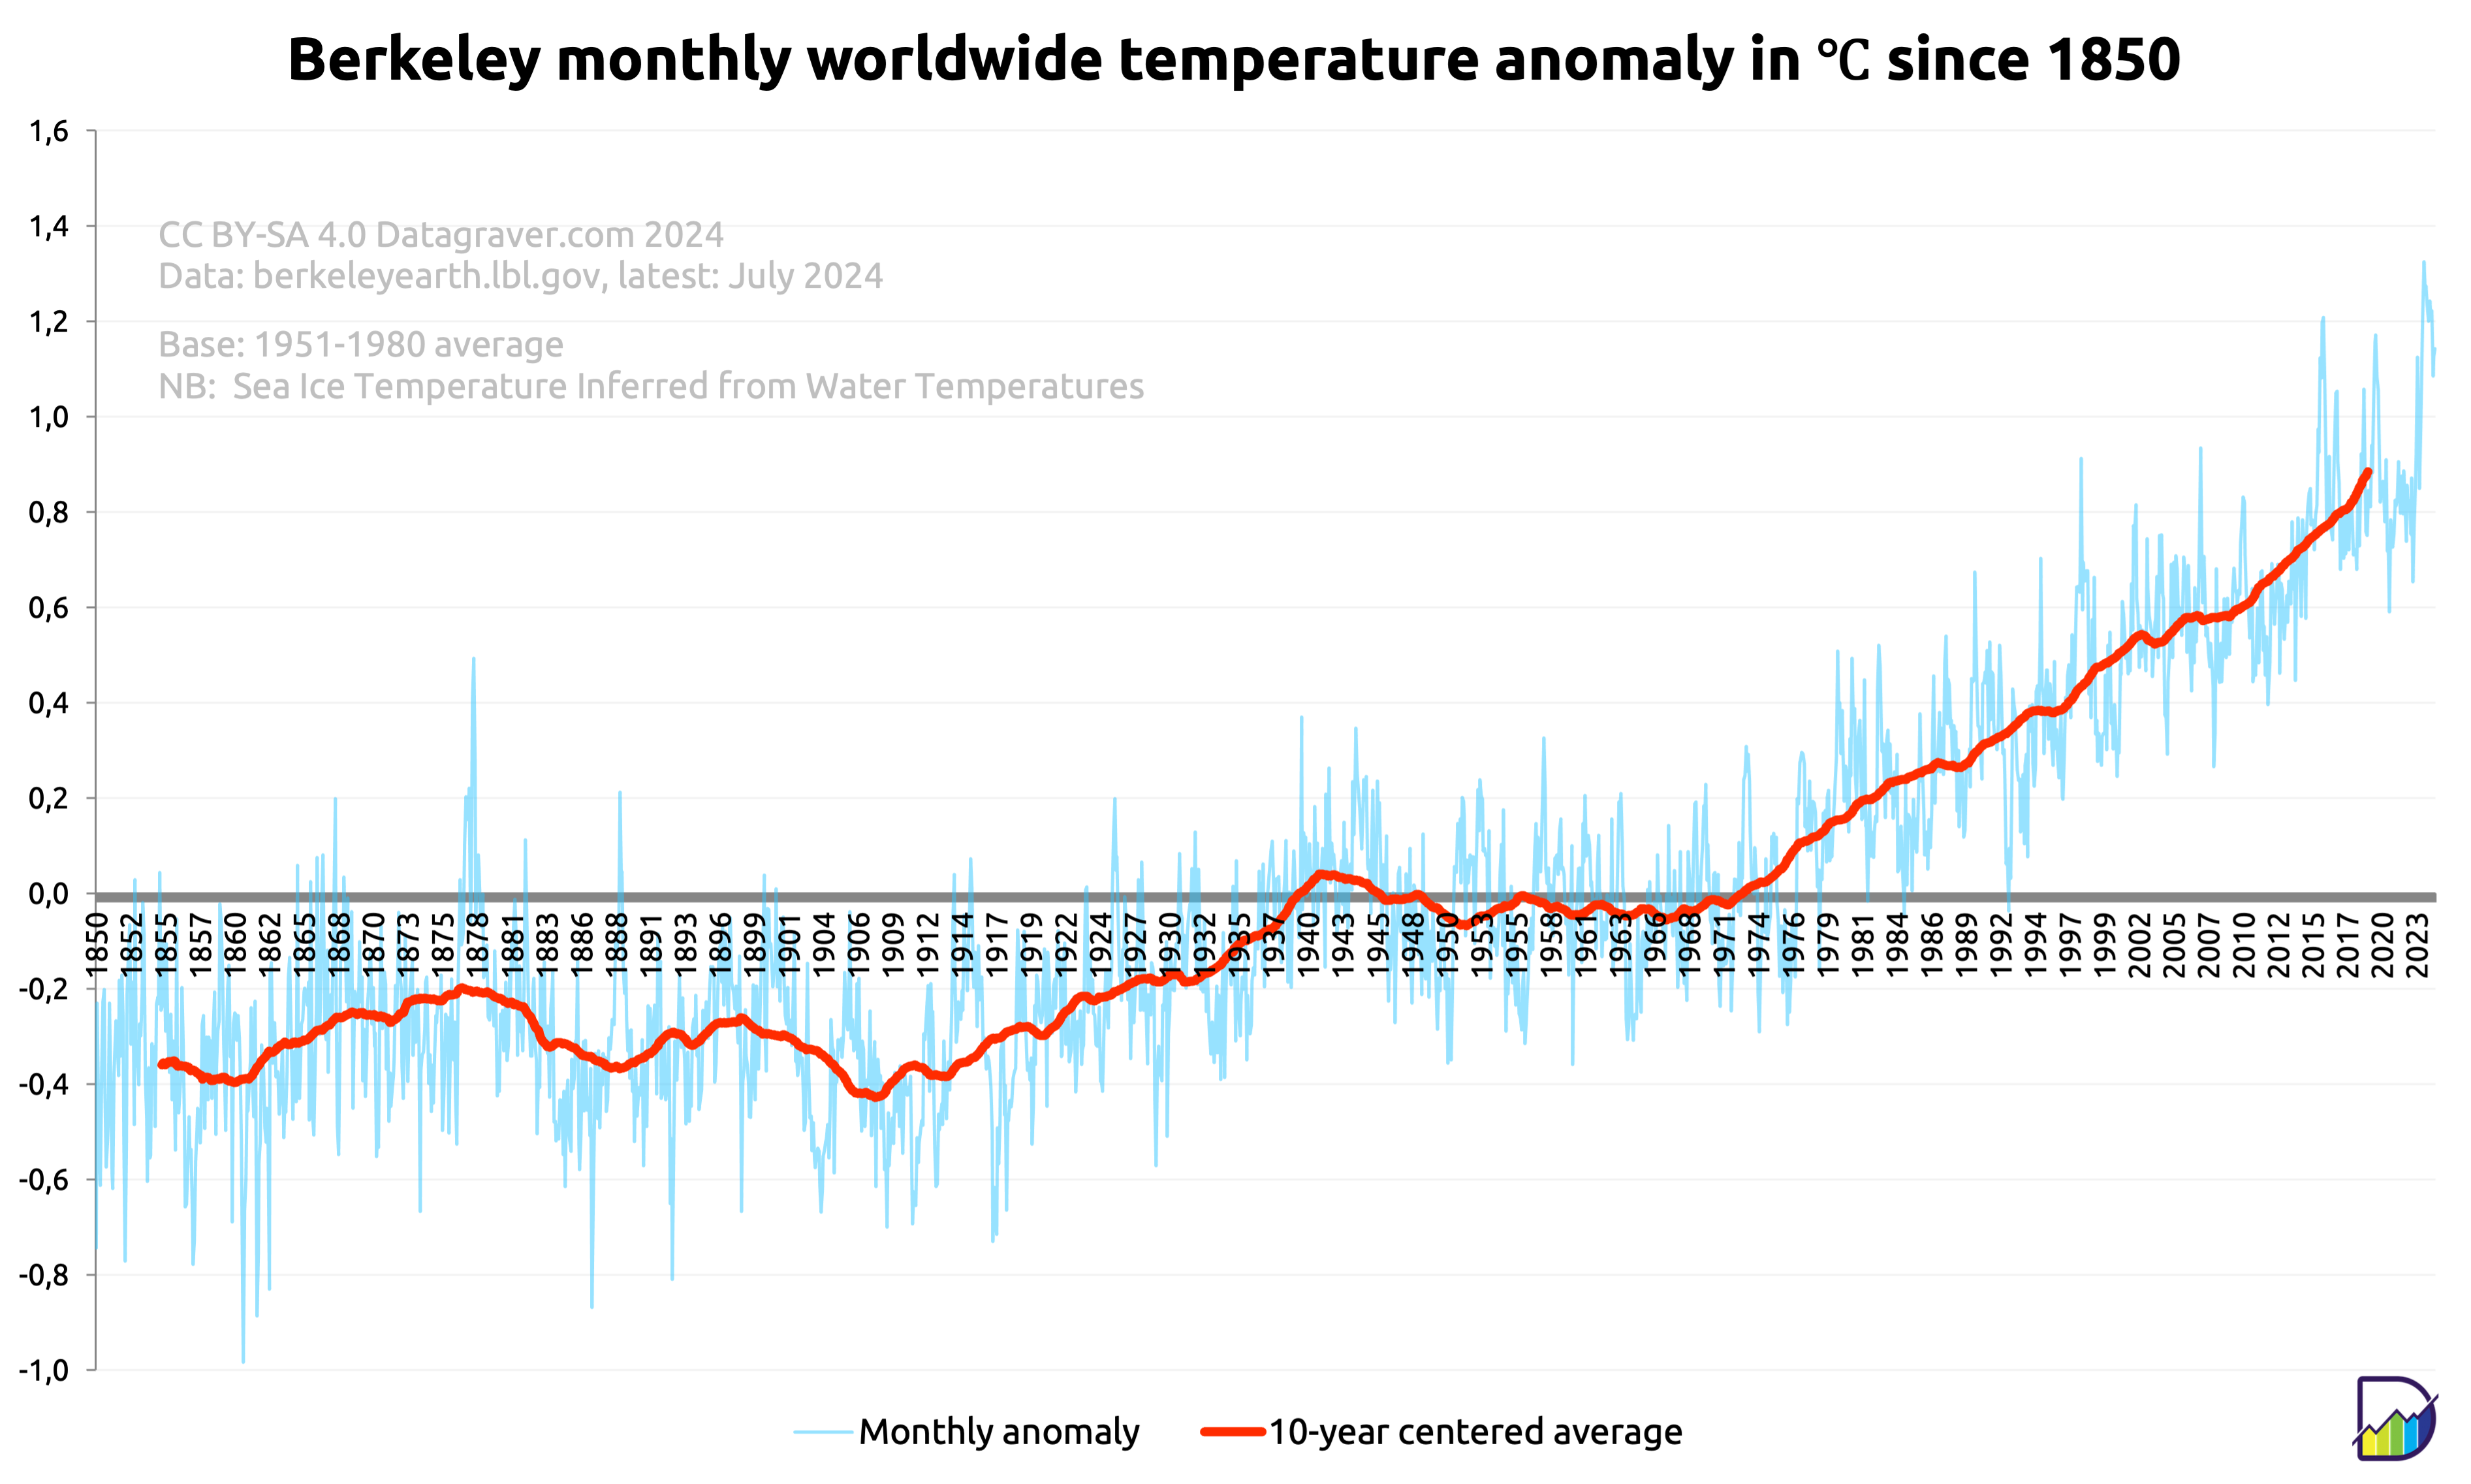
Here graphs based on the Berkeley dataset (reanalysis) created by Berkeley Earth .
Regular updates. Check date in graph.
First graph is on the monthly anomalies plus a centered 10 year average.
Digging data
Here graphs based on the Berkeley dataset (reanalysis) created by Berkeley Earth .
Regular updates. Check date in graph.
First graph is on the monthly anomalies plus a centered 10 year average.
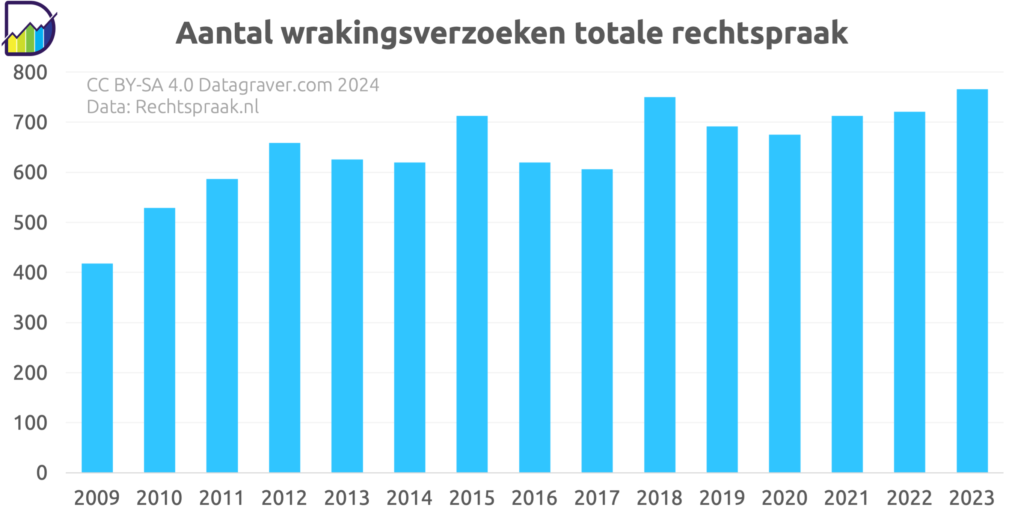
In de rechtspraak Nederland is het voor betrokken partijen mogelijk om een wrakingsverzoek in te dienen omdat men denkt dat de rechter niet onpartijdig kan zijn.
Hieronder de cijfers per jaar vanaf 2009.
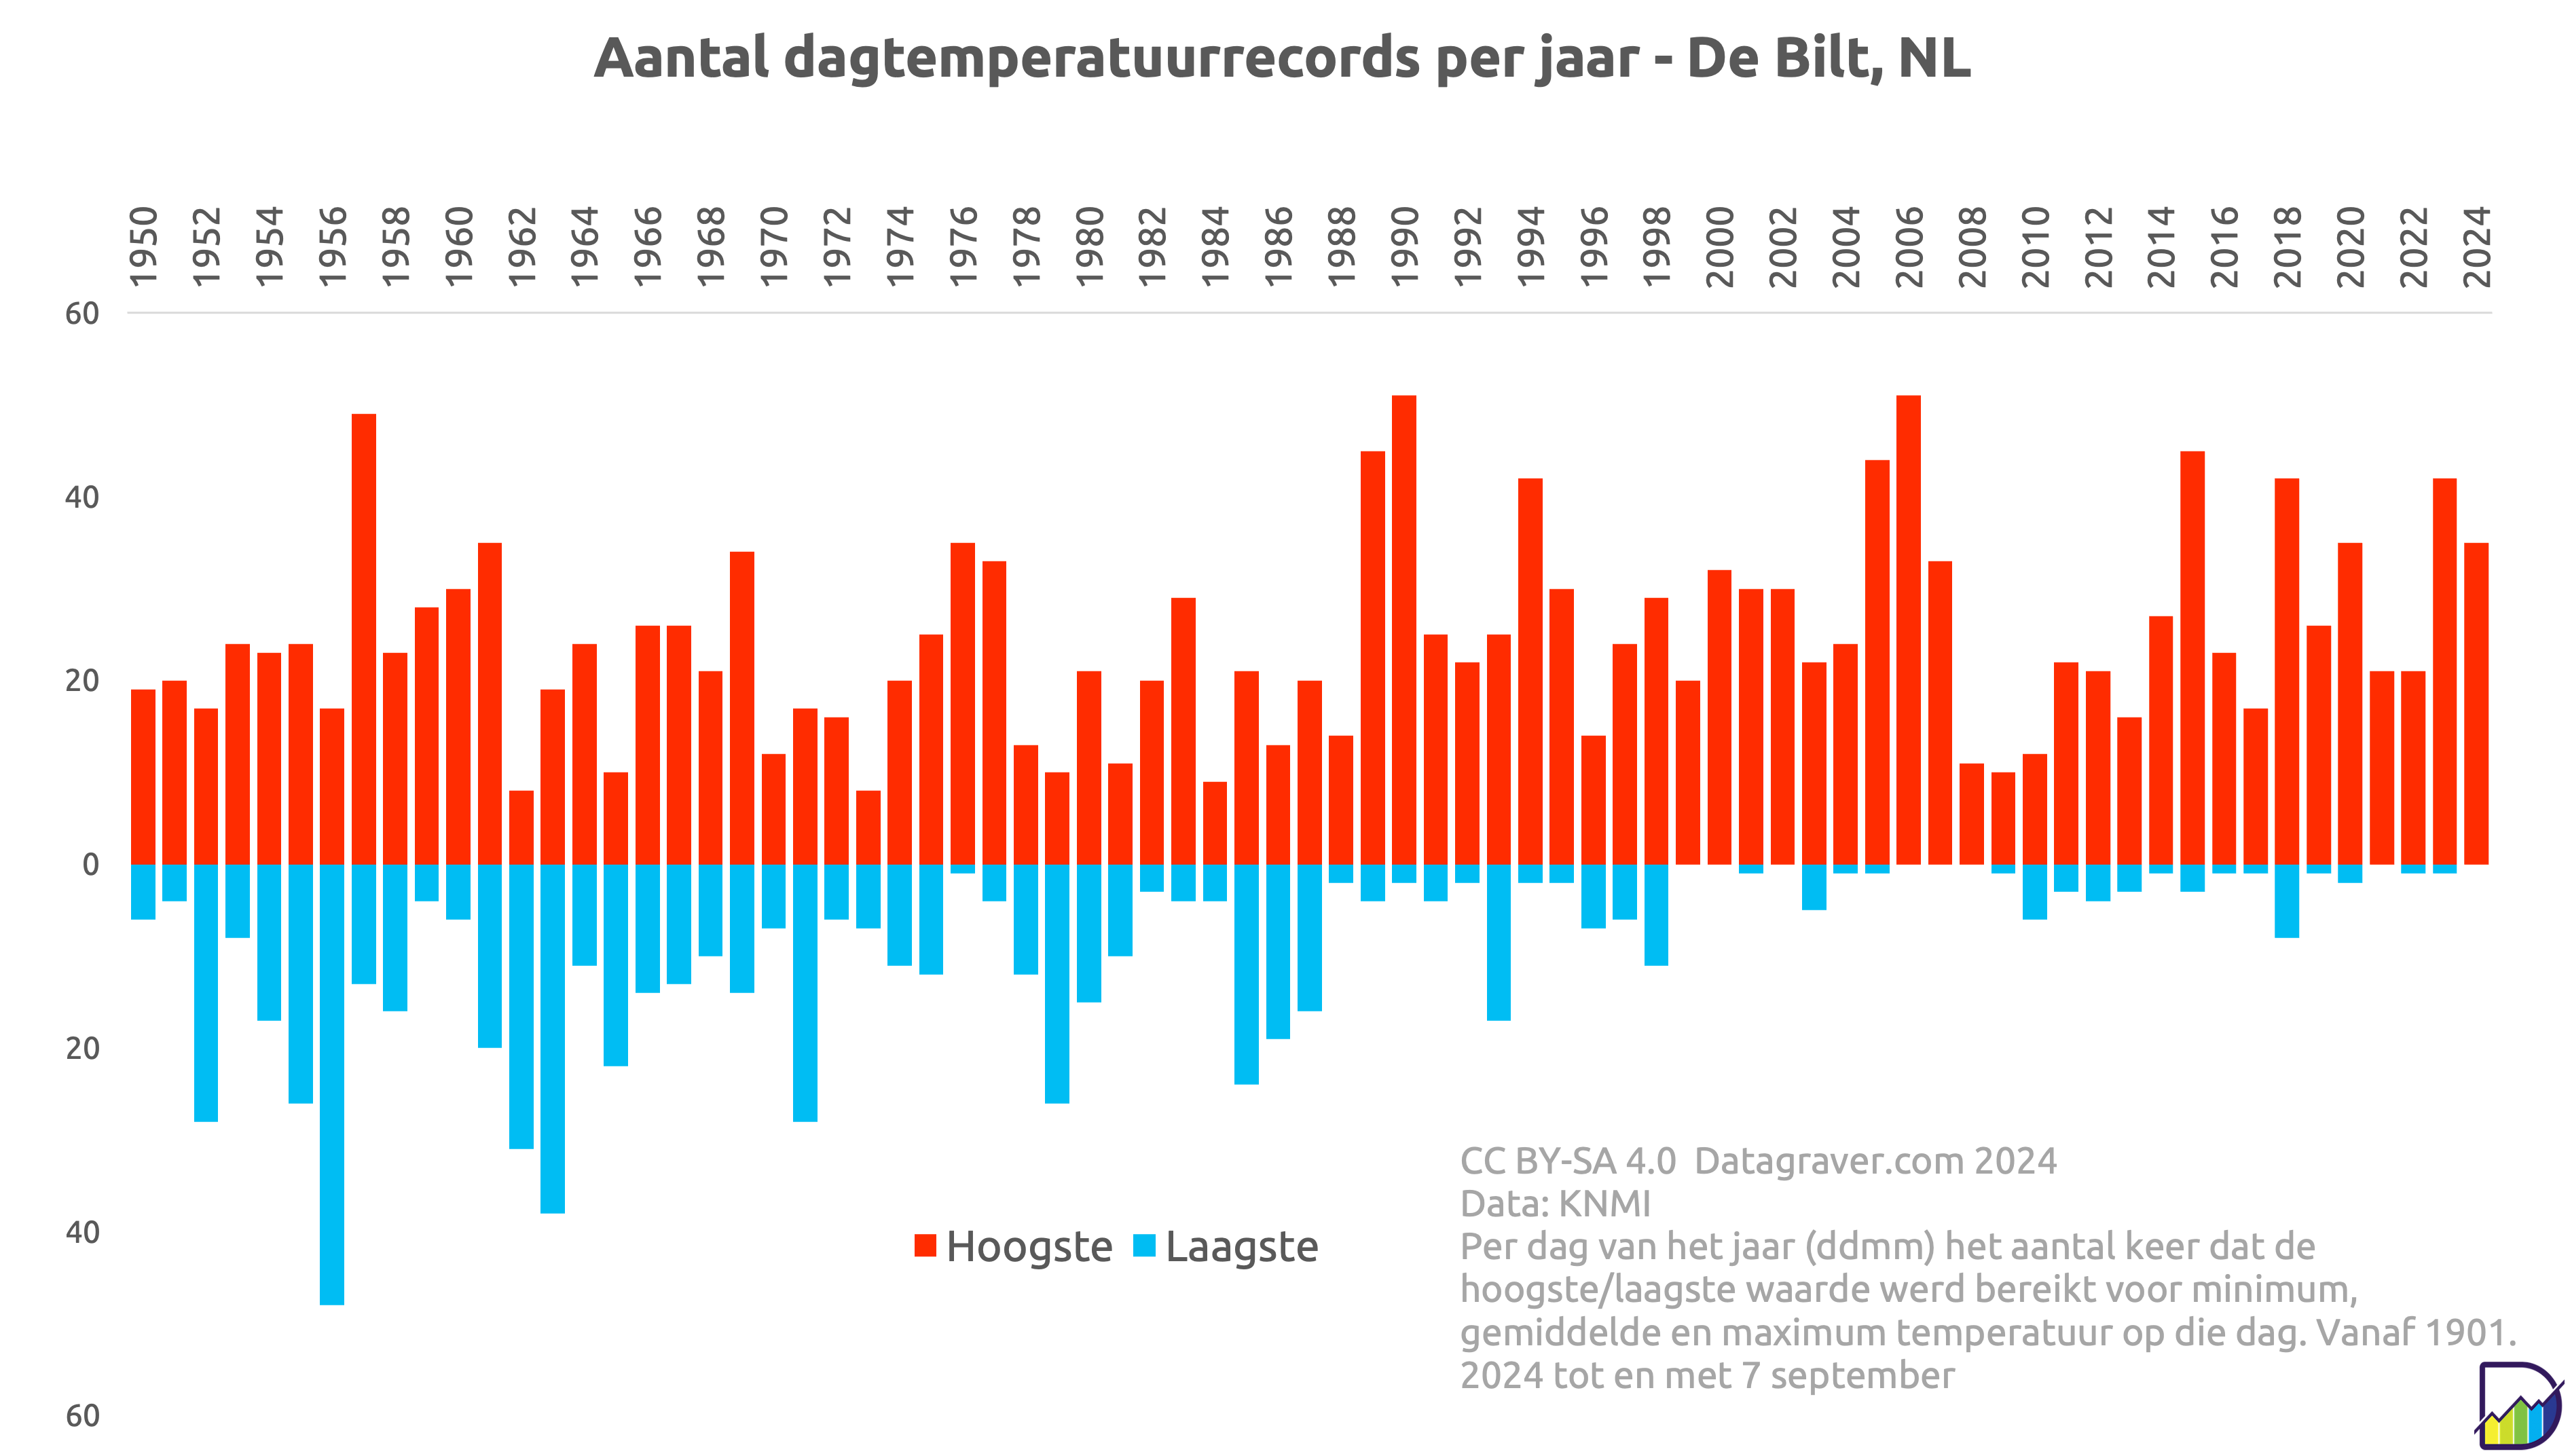
Sinds 1901 wordt dagelijks bijgehouden wat de gemiddelde, minimum en maximum temperatuur in De Bilt is. Aan de hand van die data is te bepalen of op een dag (bijvoorbeeld 4 augustus) de hoogste of laagste waarde voor een van alle 4 augustus metingen sinds 1901 is bereikt. Dit telt in het jaar dat het gebeurt dan als 1 maximum (rood, boven x-as) of minimum (blauw, onder x-as) record.
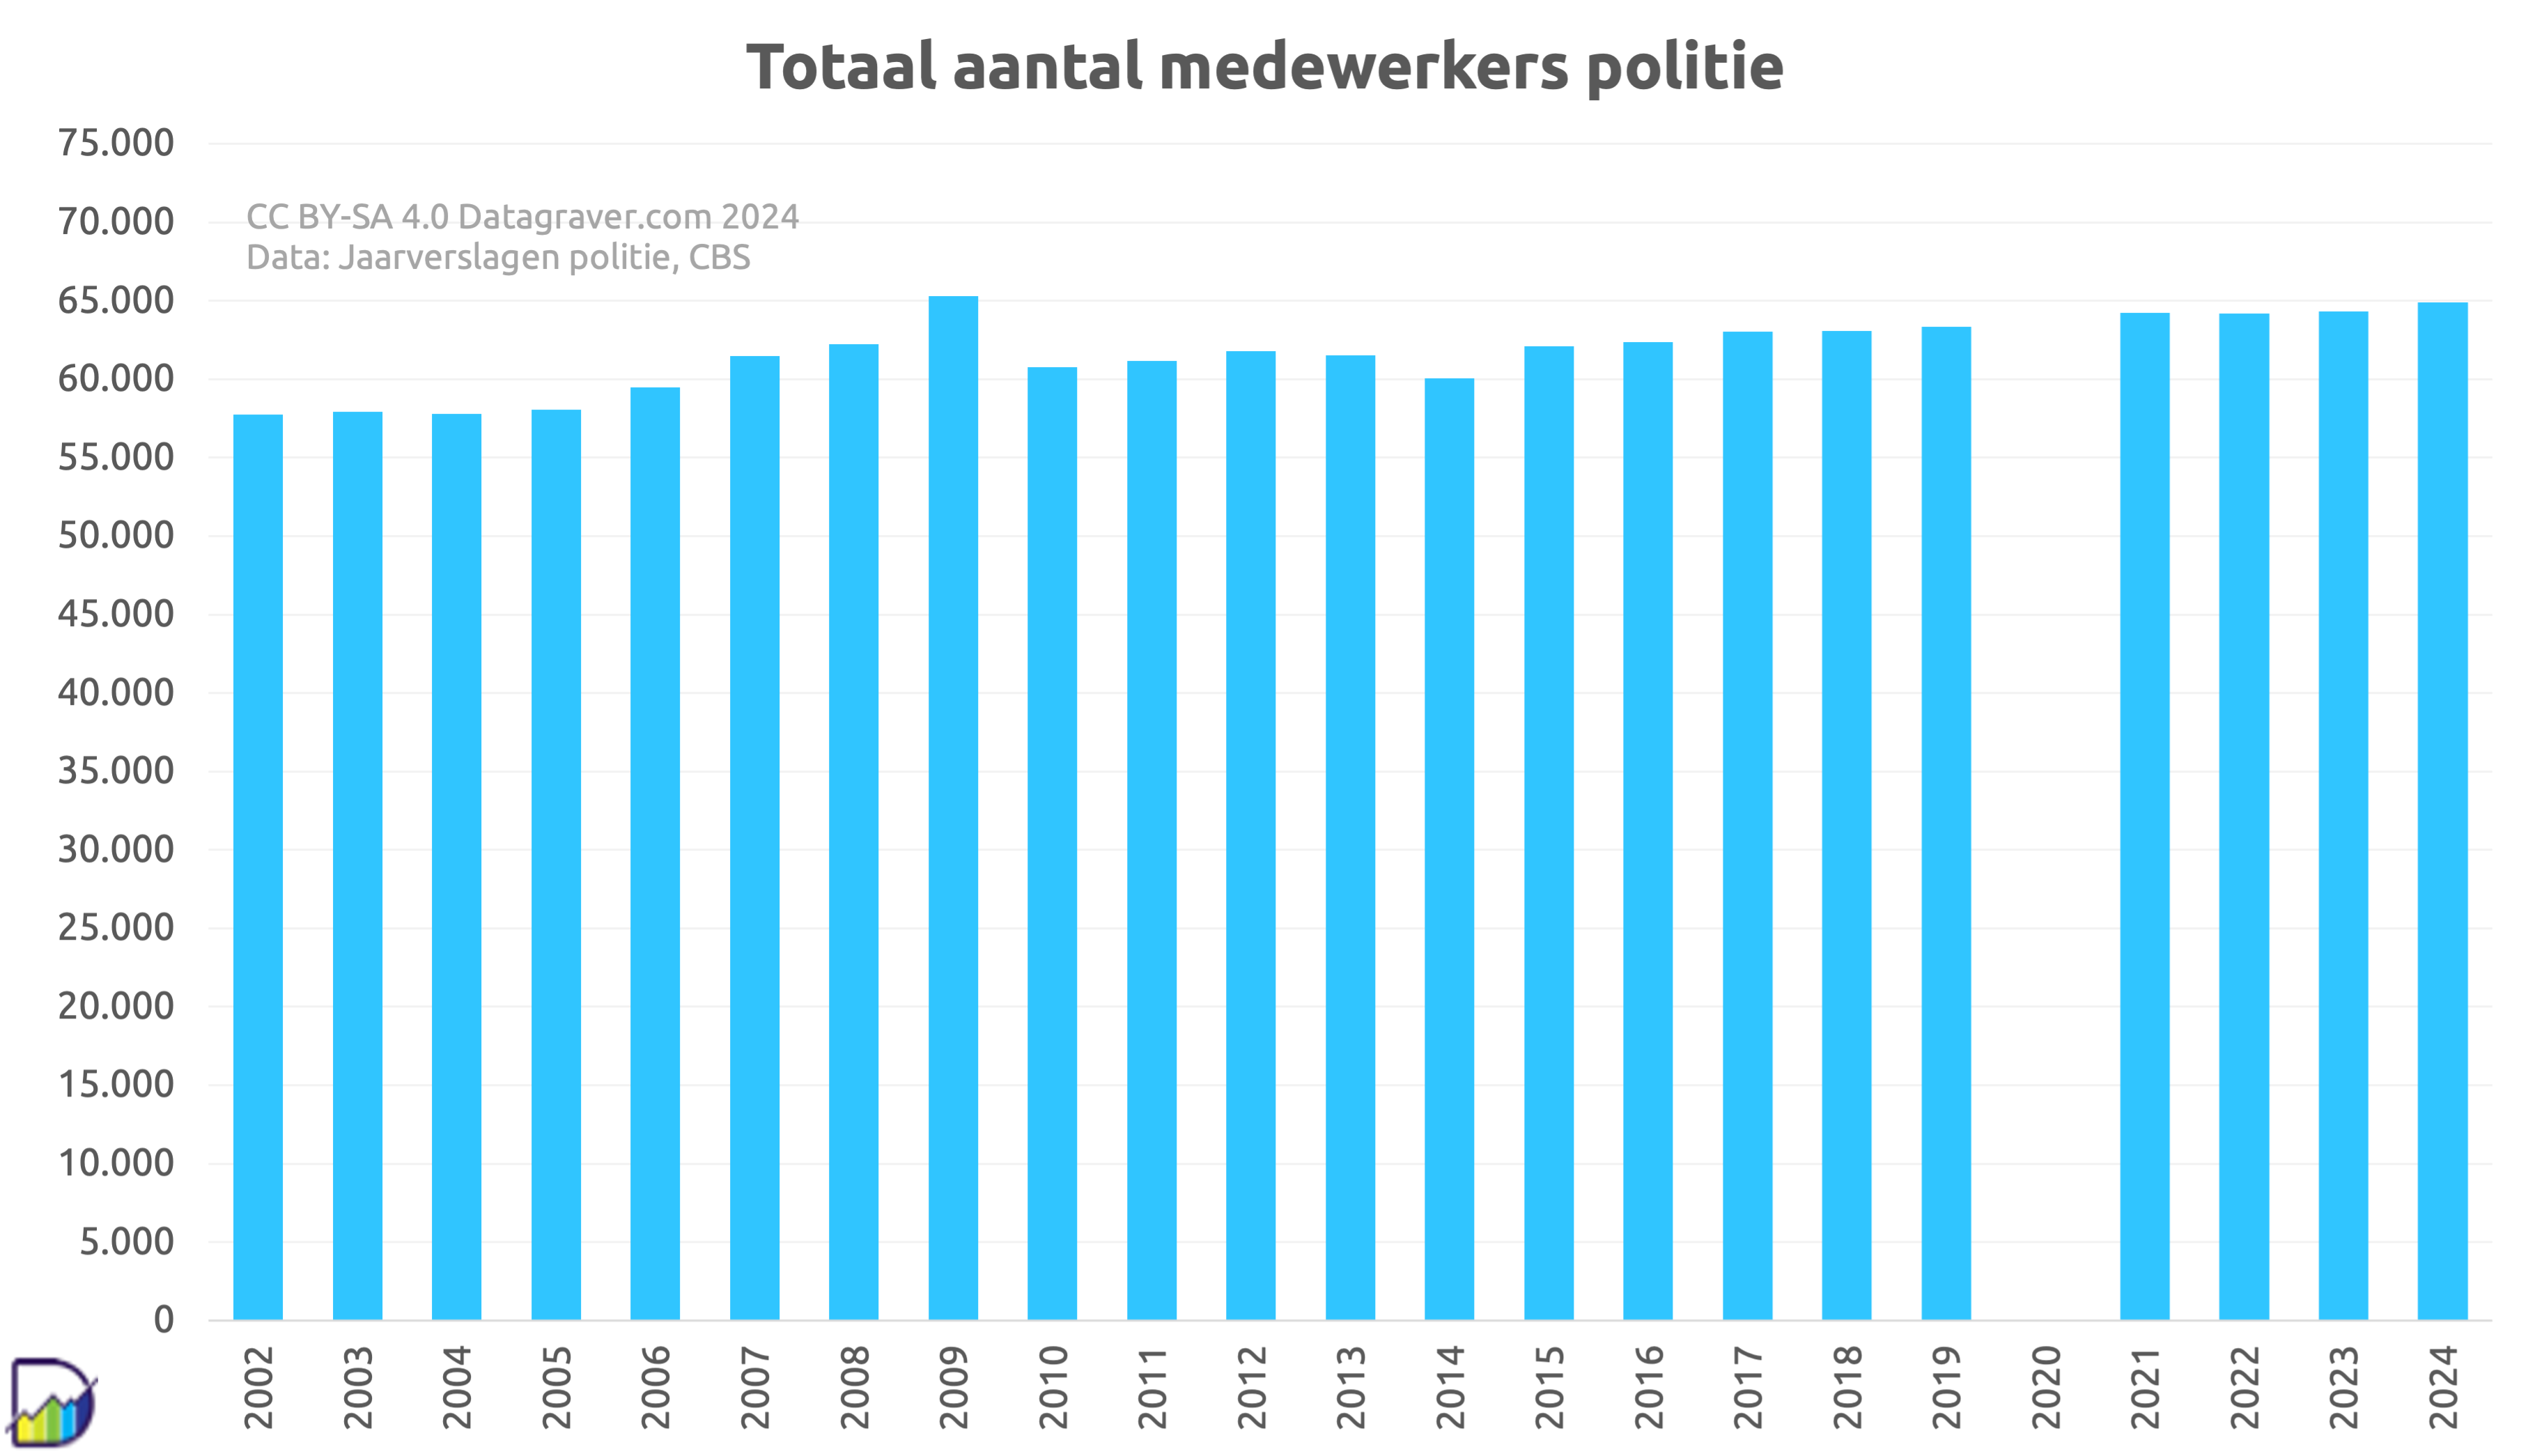
Diverse grafieken om omvang politie Nederland uit te drukken door de tijd. Zowel in mensen als in FTE (Full Time Equivalent, voltijds).
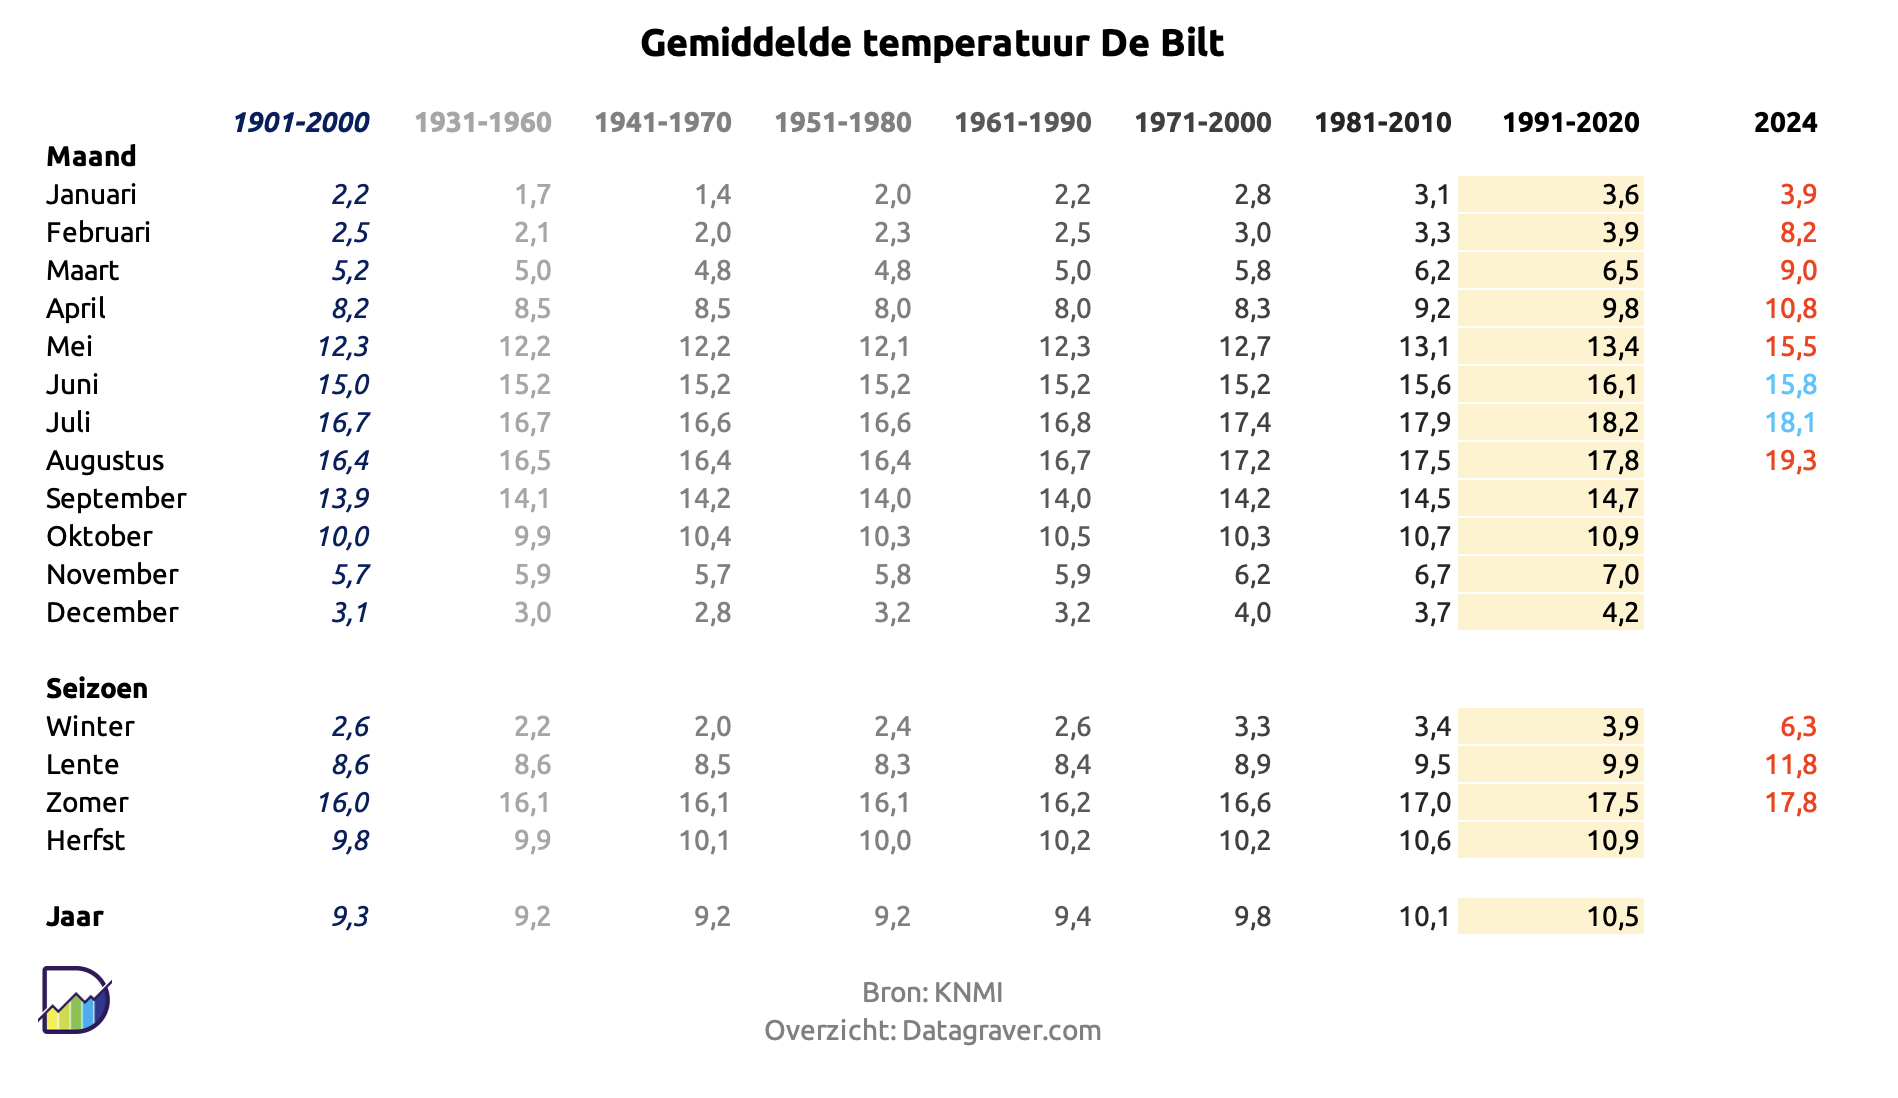
Voor de Bilt wordt per maand, per seizoen en per jaar een gemiddelde temperatuur gegeven. Vaak wordt dit vergeleken met een referentie periode (het “normaal”). In onderstaand overzicht vergelijken we de gemiddelden met de huidige en eerdere normalen.
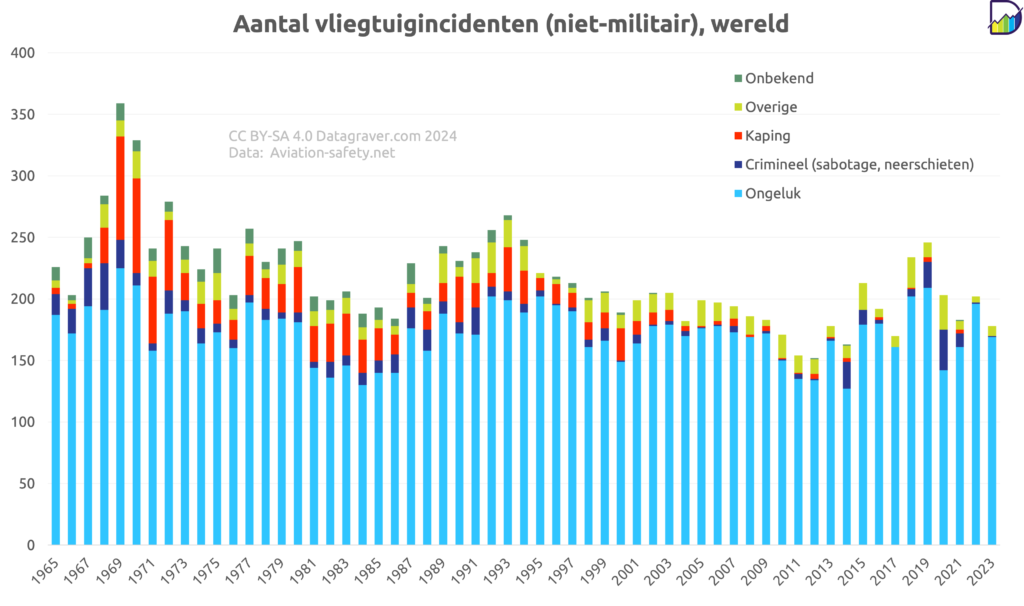
Overzicht vliegincidenten, exclusief militair, gehele wereld zoals verzameld door Aviation Safety Network.
Eerst aantal incidenten naar soort oorzaak.
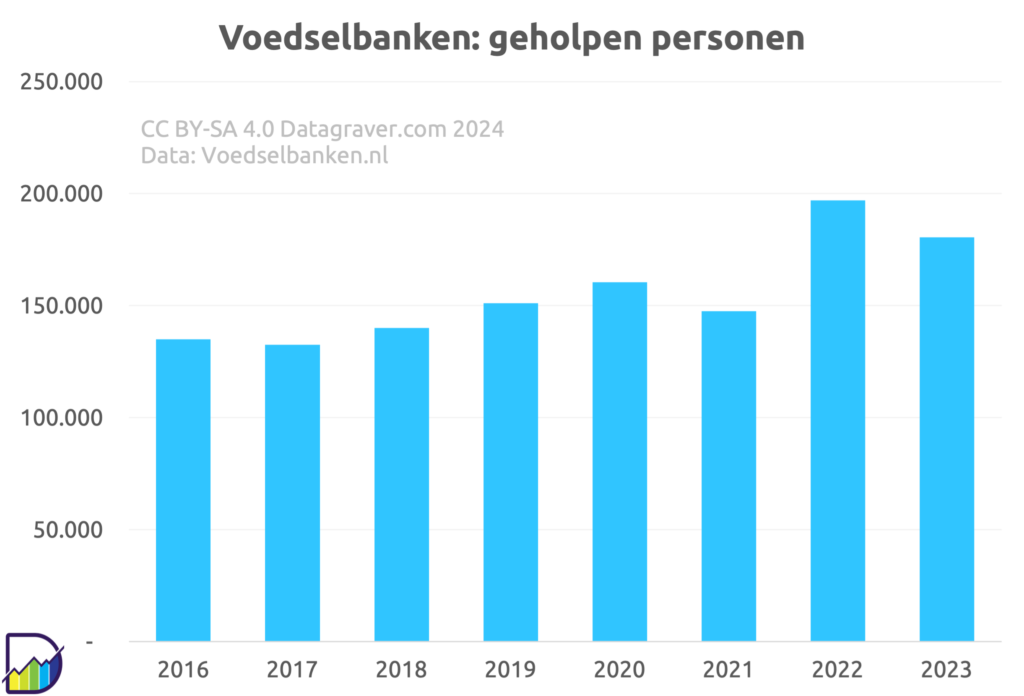
Data over de voedselbanken in Nederland.
Aller eerst het aantal geholpen personen per jaar.
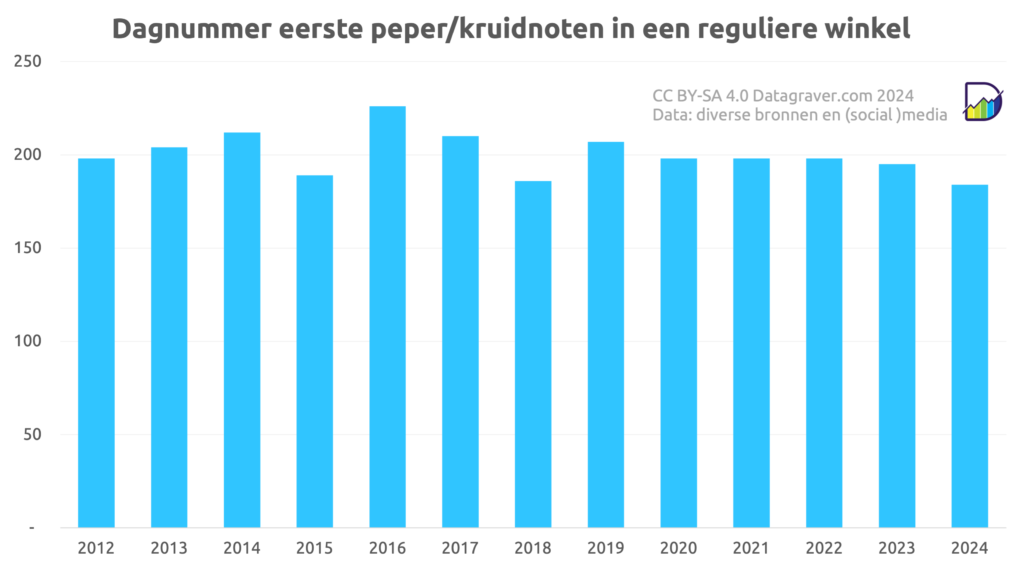
Ieder jaar verbazen mensen zich over het “vroeg” verschijnen van de eerste pepernoten/kruidnoten in de winkel. We hebben de data van de afgelopen jaren bij elkaar gesprokkeld. Daaruit blijkt dat eigenlijk er altijd al losse winkels zijn die in juli de eerste pepernoten verkopen. En dat de grote ketens in de laatste week van augustus hiermee starten.
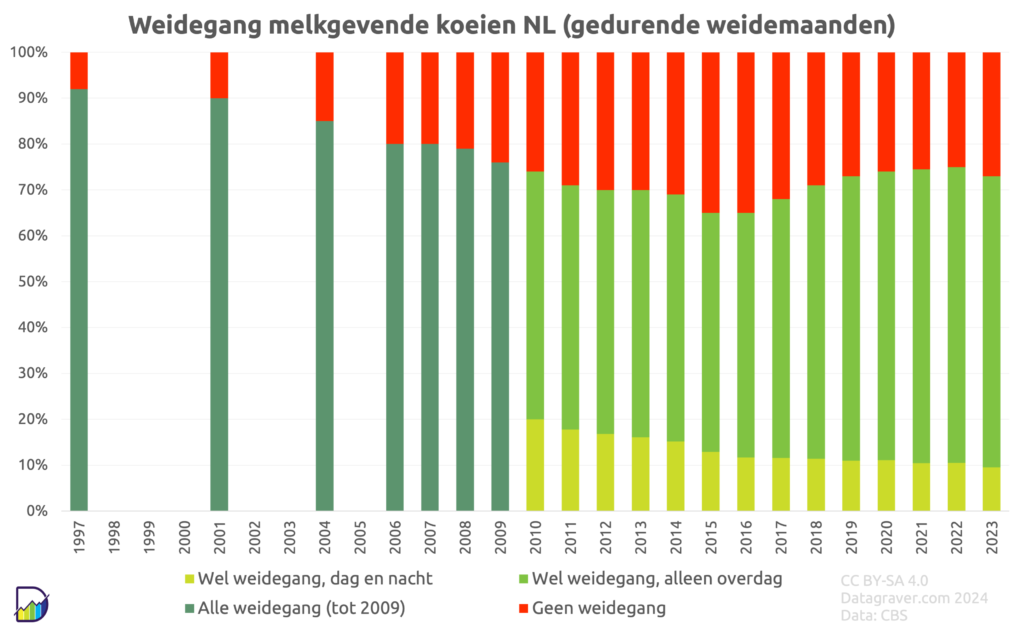
Gedurende de weidemaanden kan een deel van de melkgevende koeien naar buiten. Onderstaande grafiek geeft de verhouding weer tussen welk deel wel en welk deel niet, waarbij vanaf 2010 uitgesplitst is of het naar buiten kunnen alleen overdag is of dag en nacht.
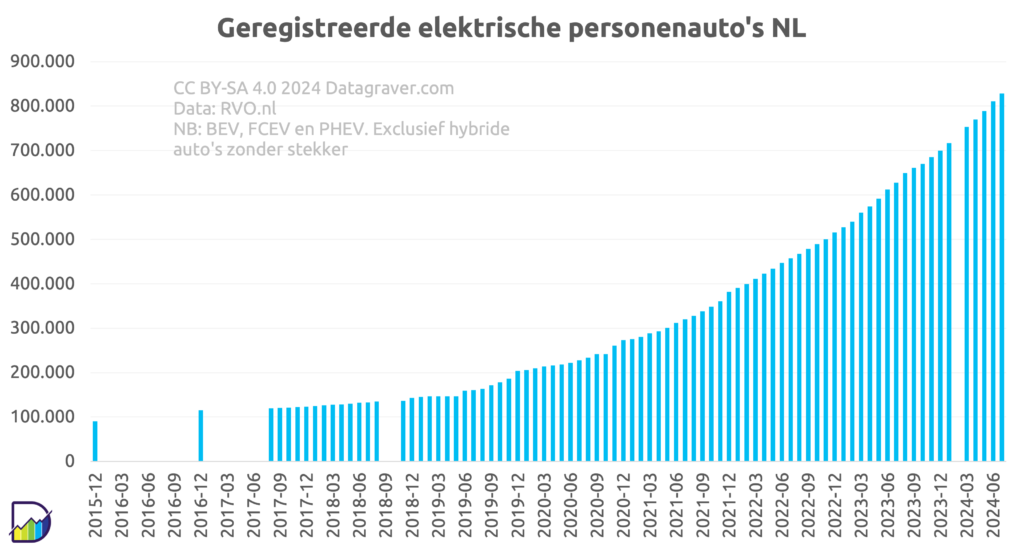
Ontwikkeling van aantal elektrische personenauto’s geregistreerd in Nederland. Dit zijn alle auto’s die geheel of gedeeltelijk op elektriciteit rijden en via een laadpunt oplaadbaar zijn.