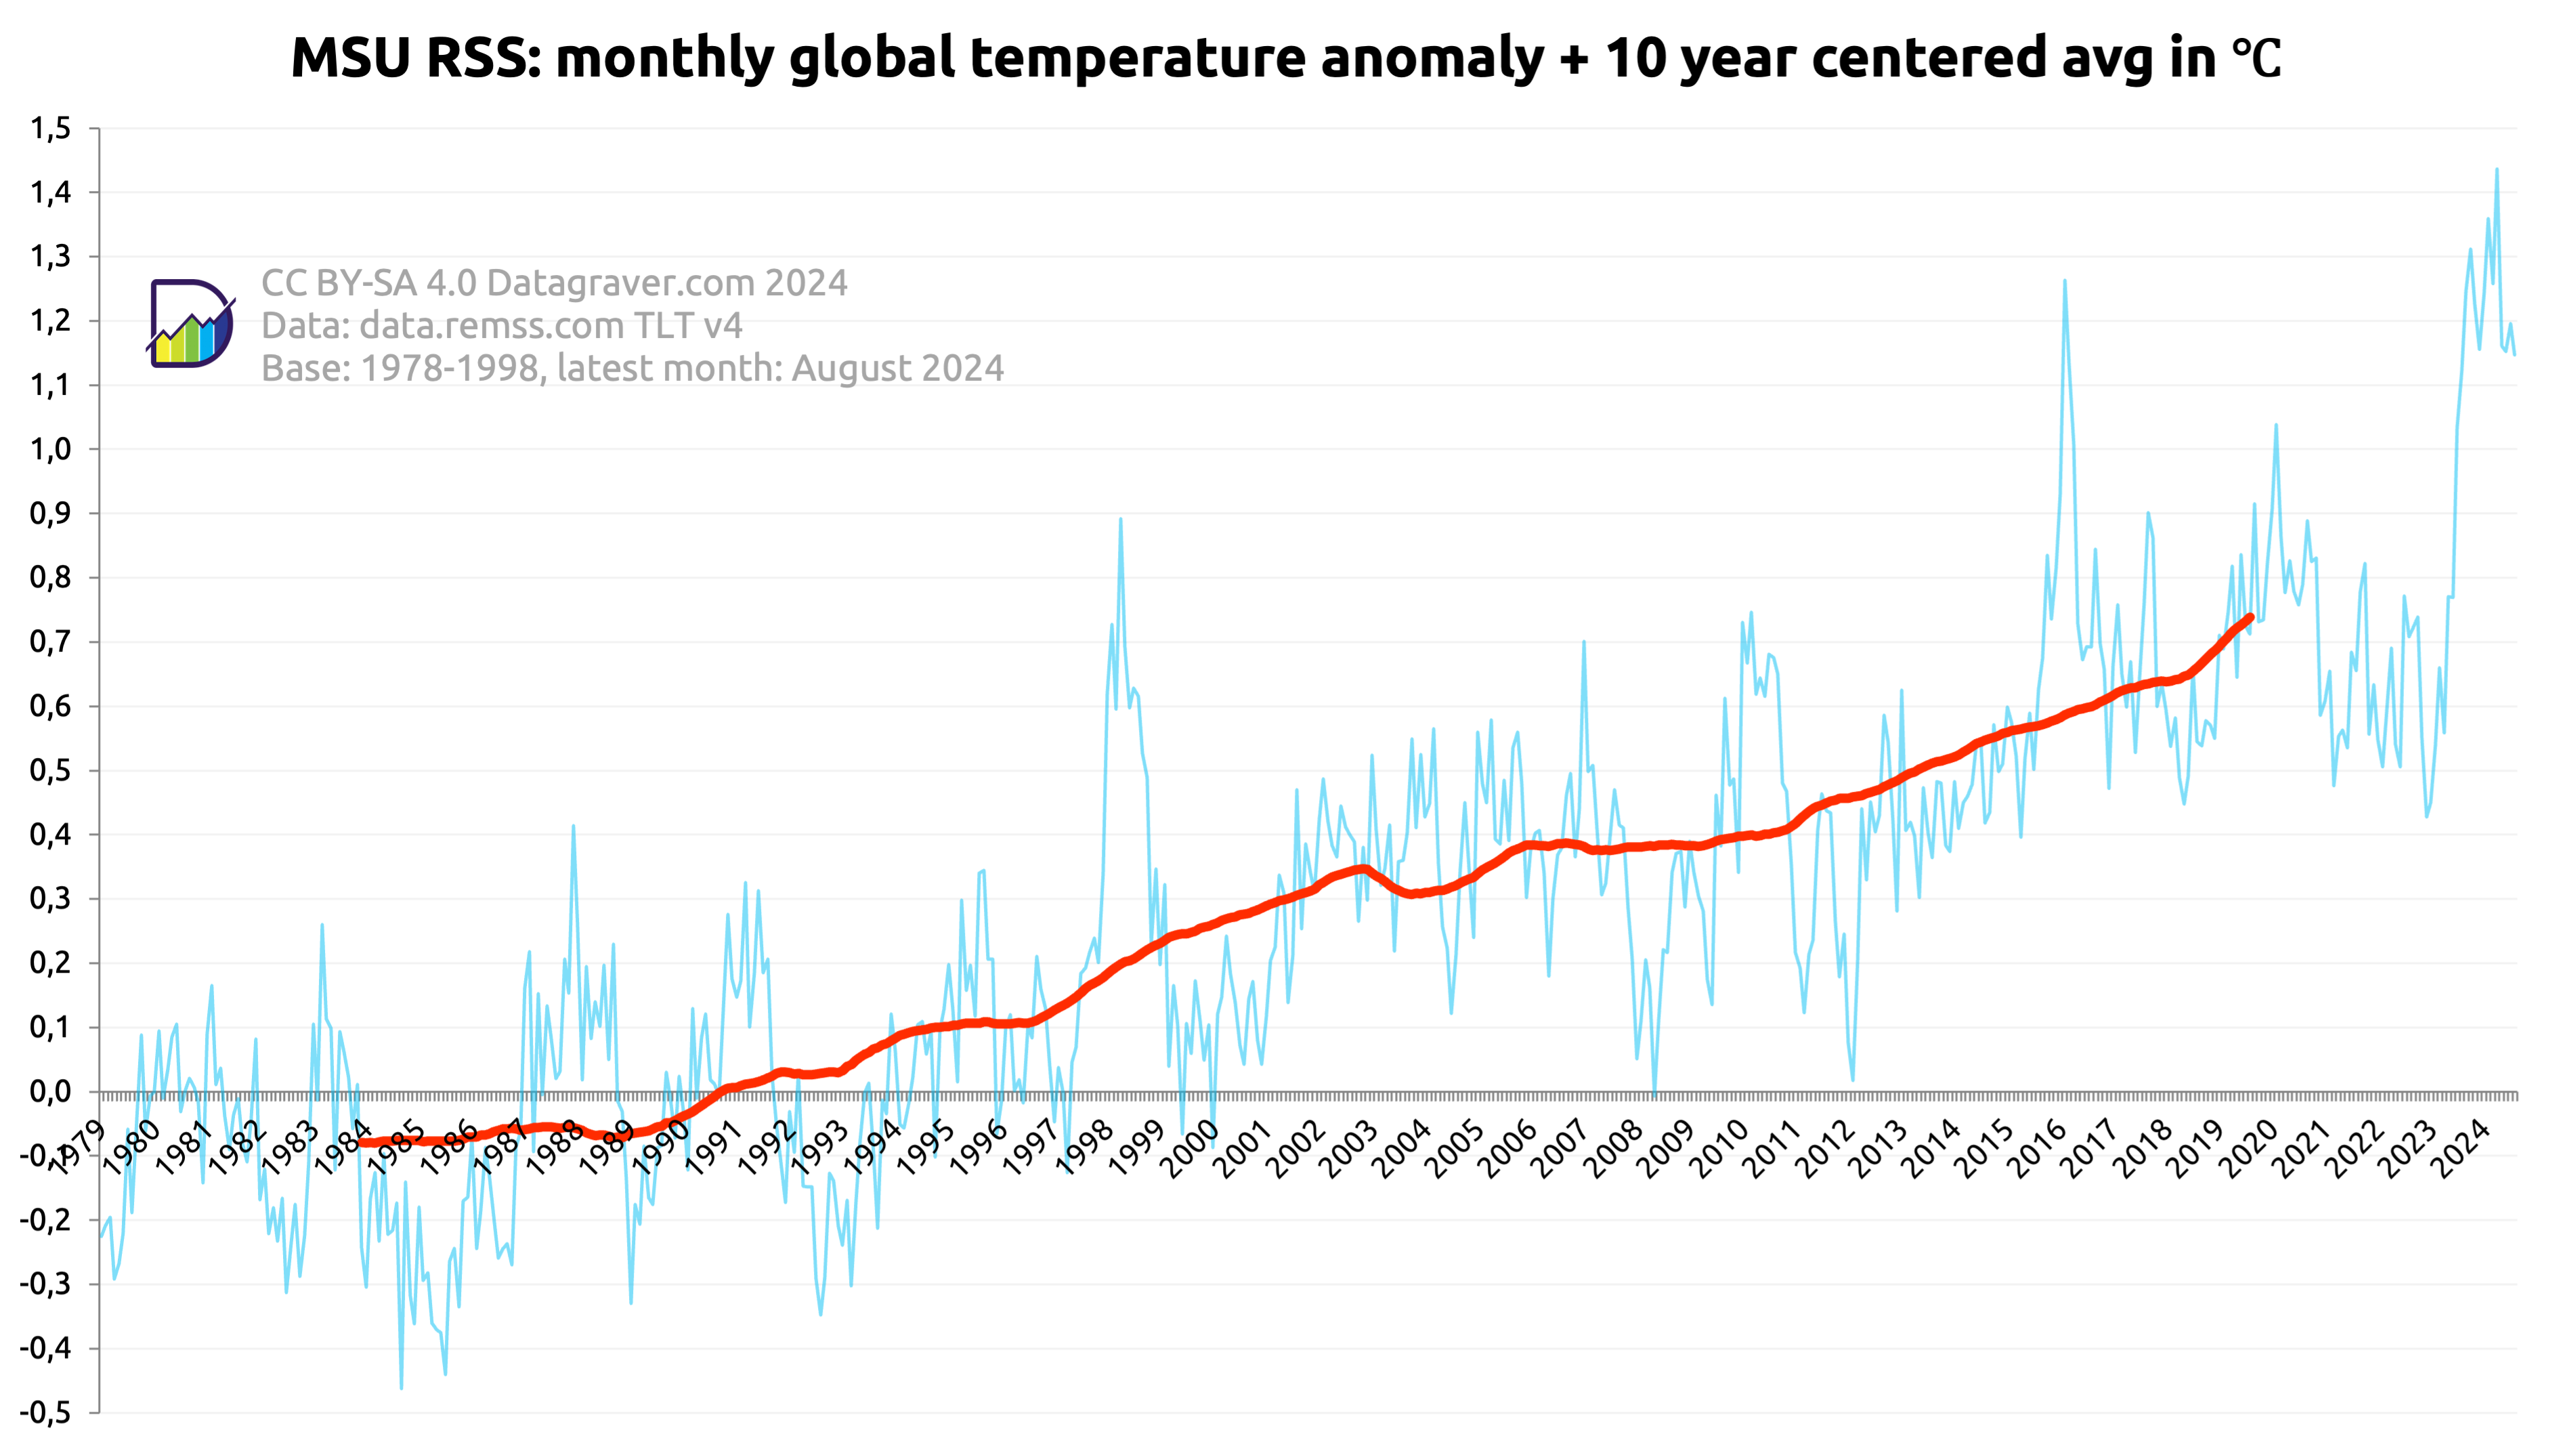
Here graphs based on the REMSS dataset.
Regular updates. Check date in graph.
First graph is on the monthly anomalies plus a centered 10 year average.
Digging data
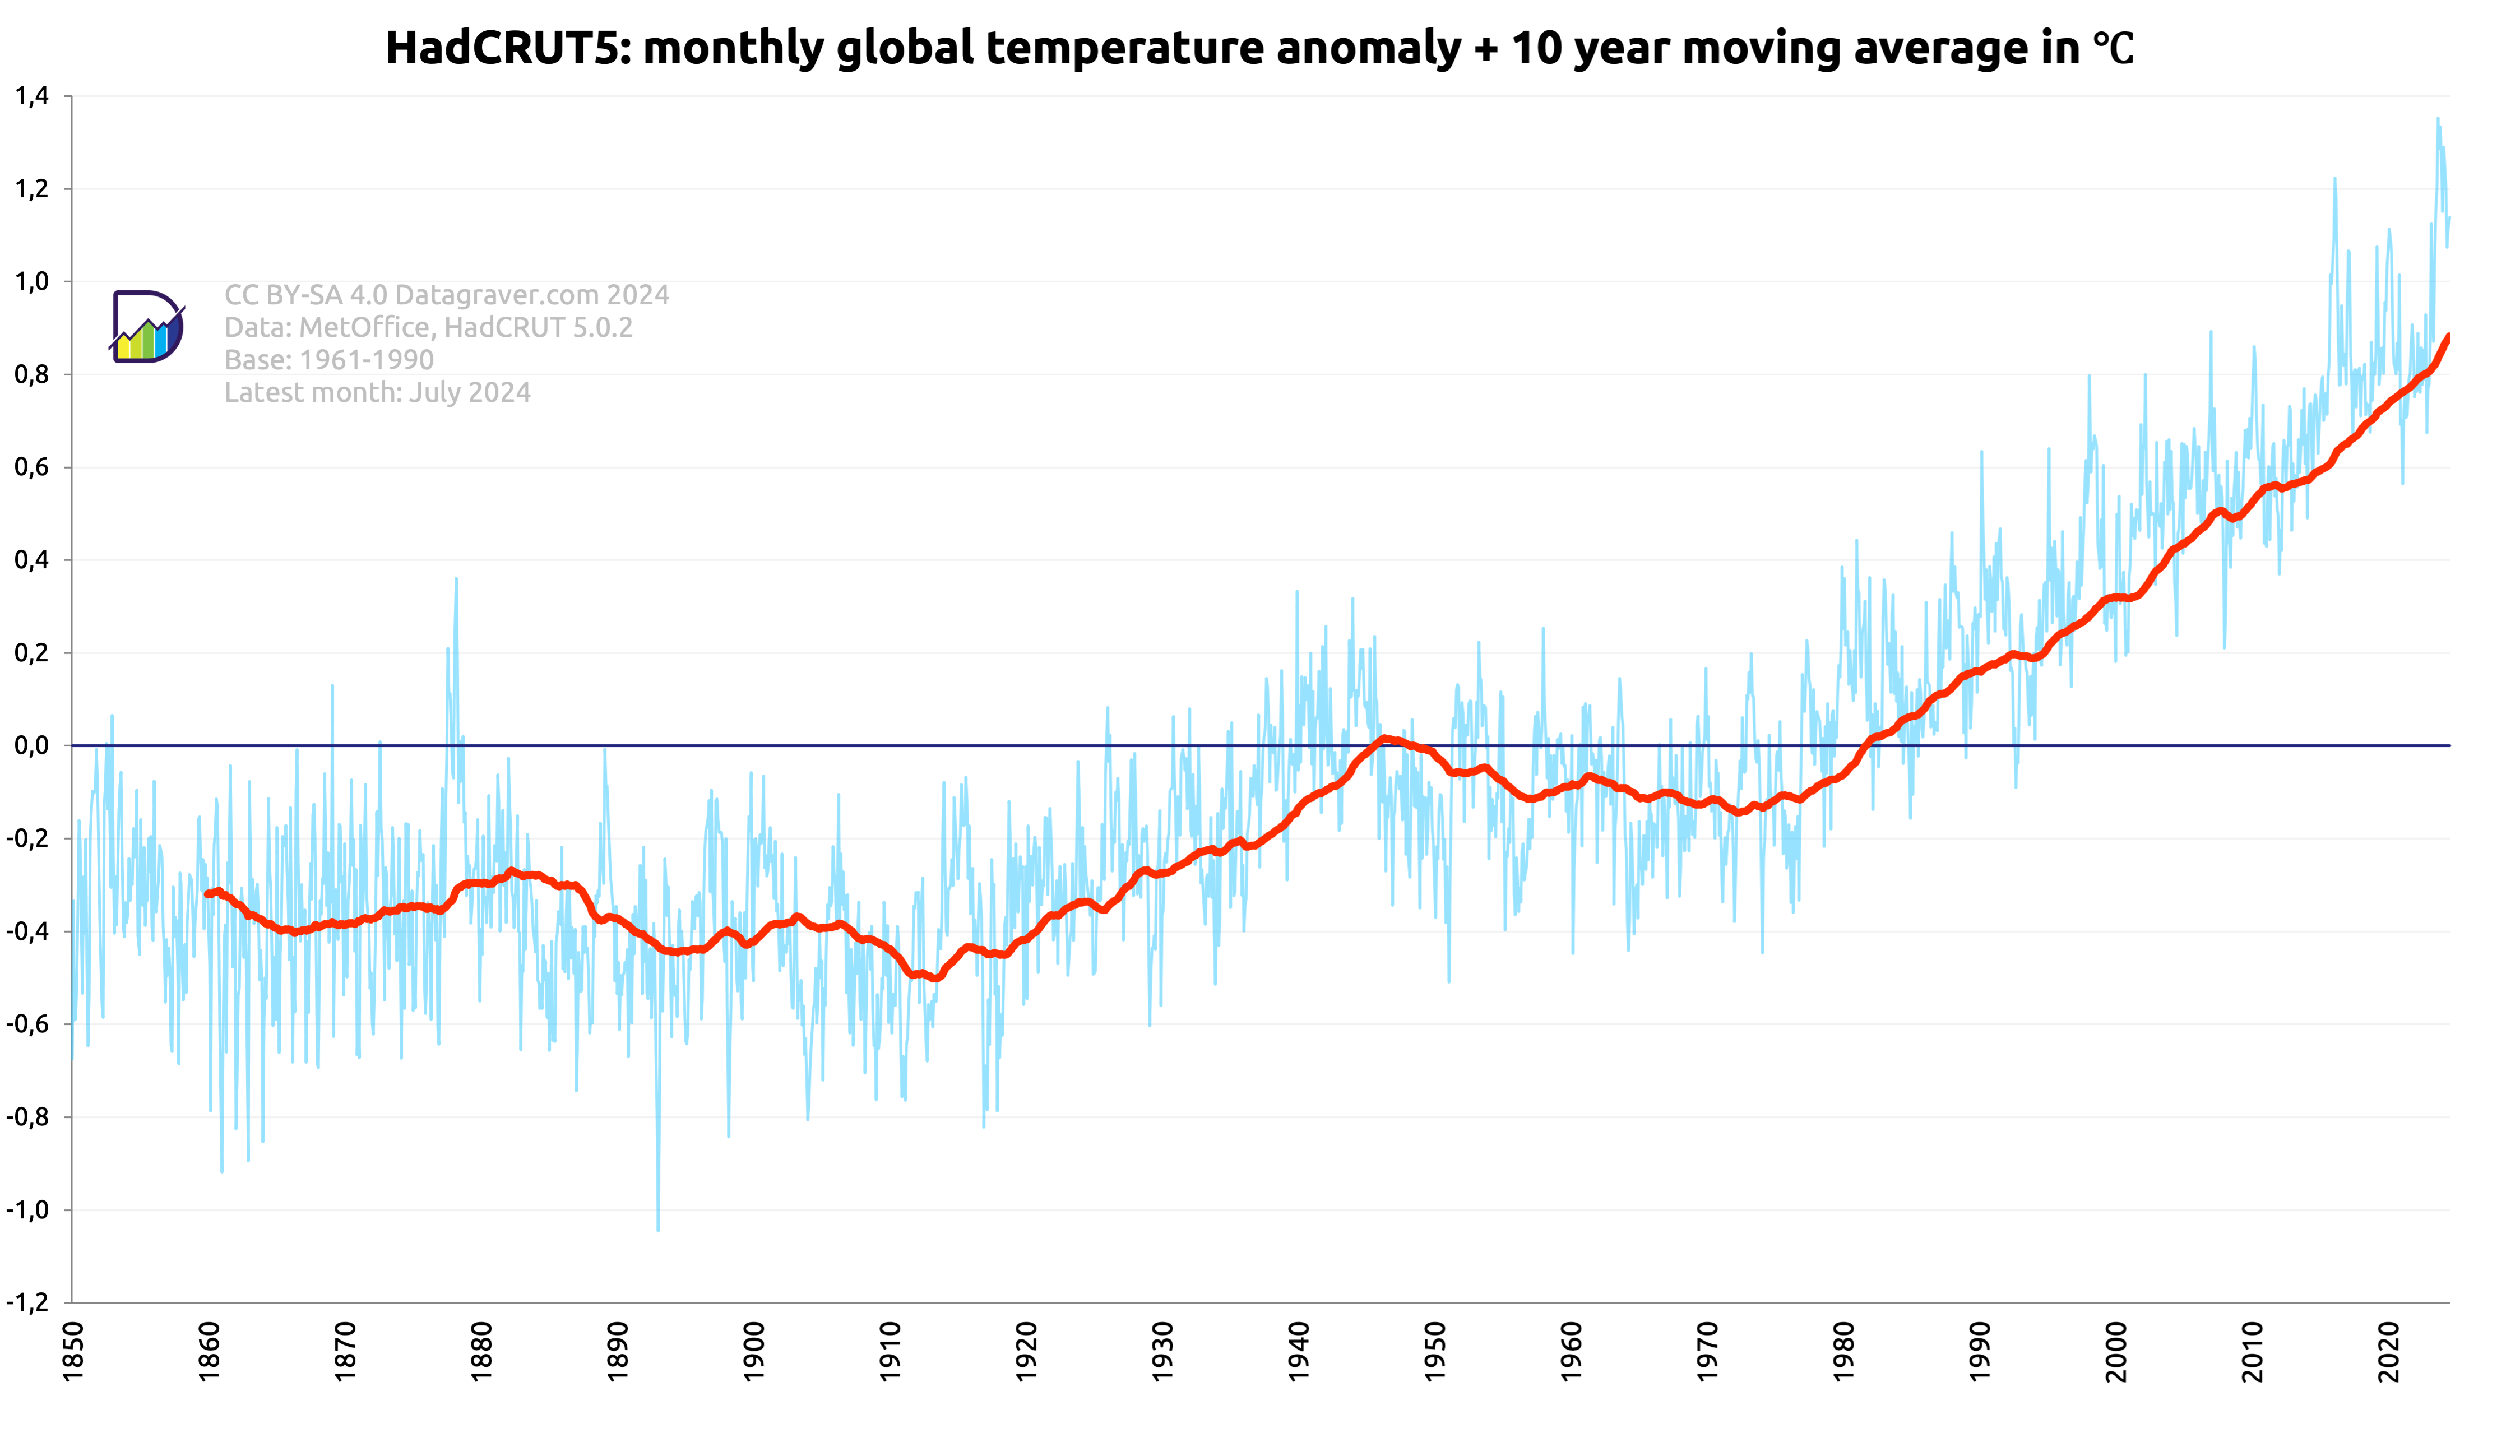
Here graphs based on the HadCRUT 5.0.2 dataset created by the Met Office (UK).
Regular updates. Check date in graph.
First graph is on the monthly anomalies plus a moving 10 year average.
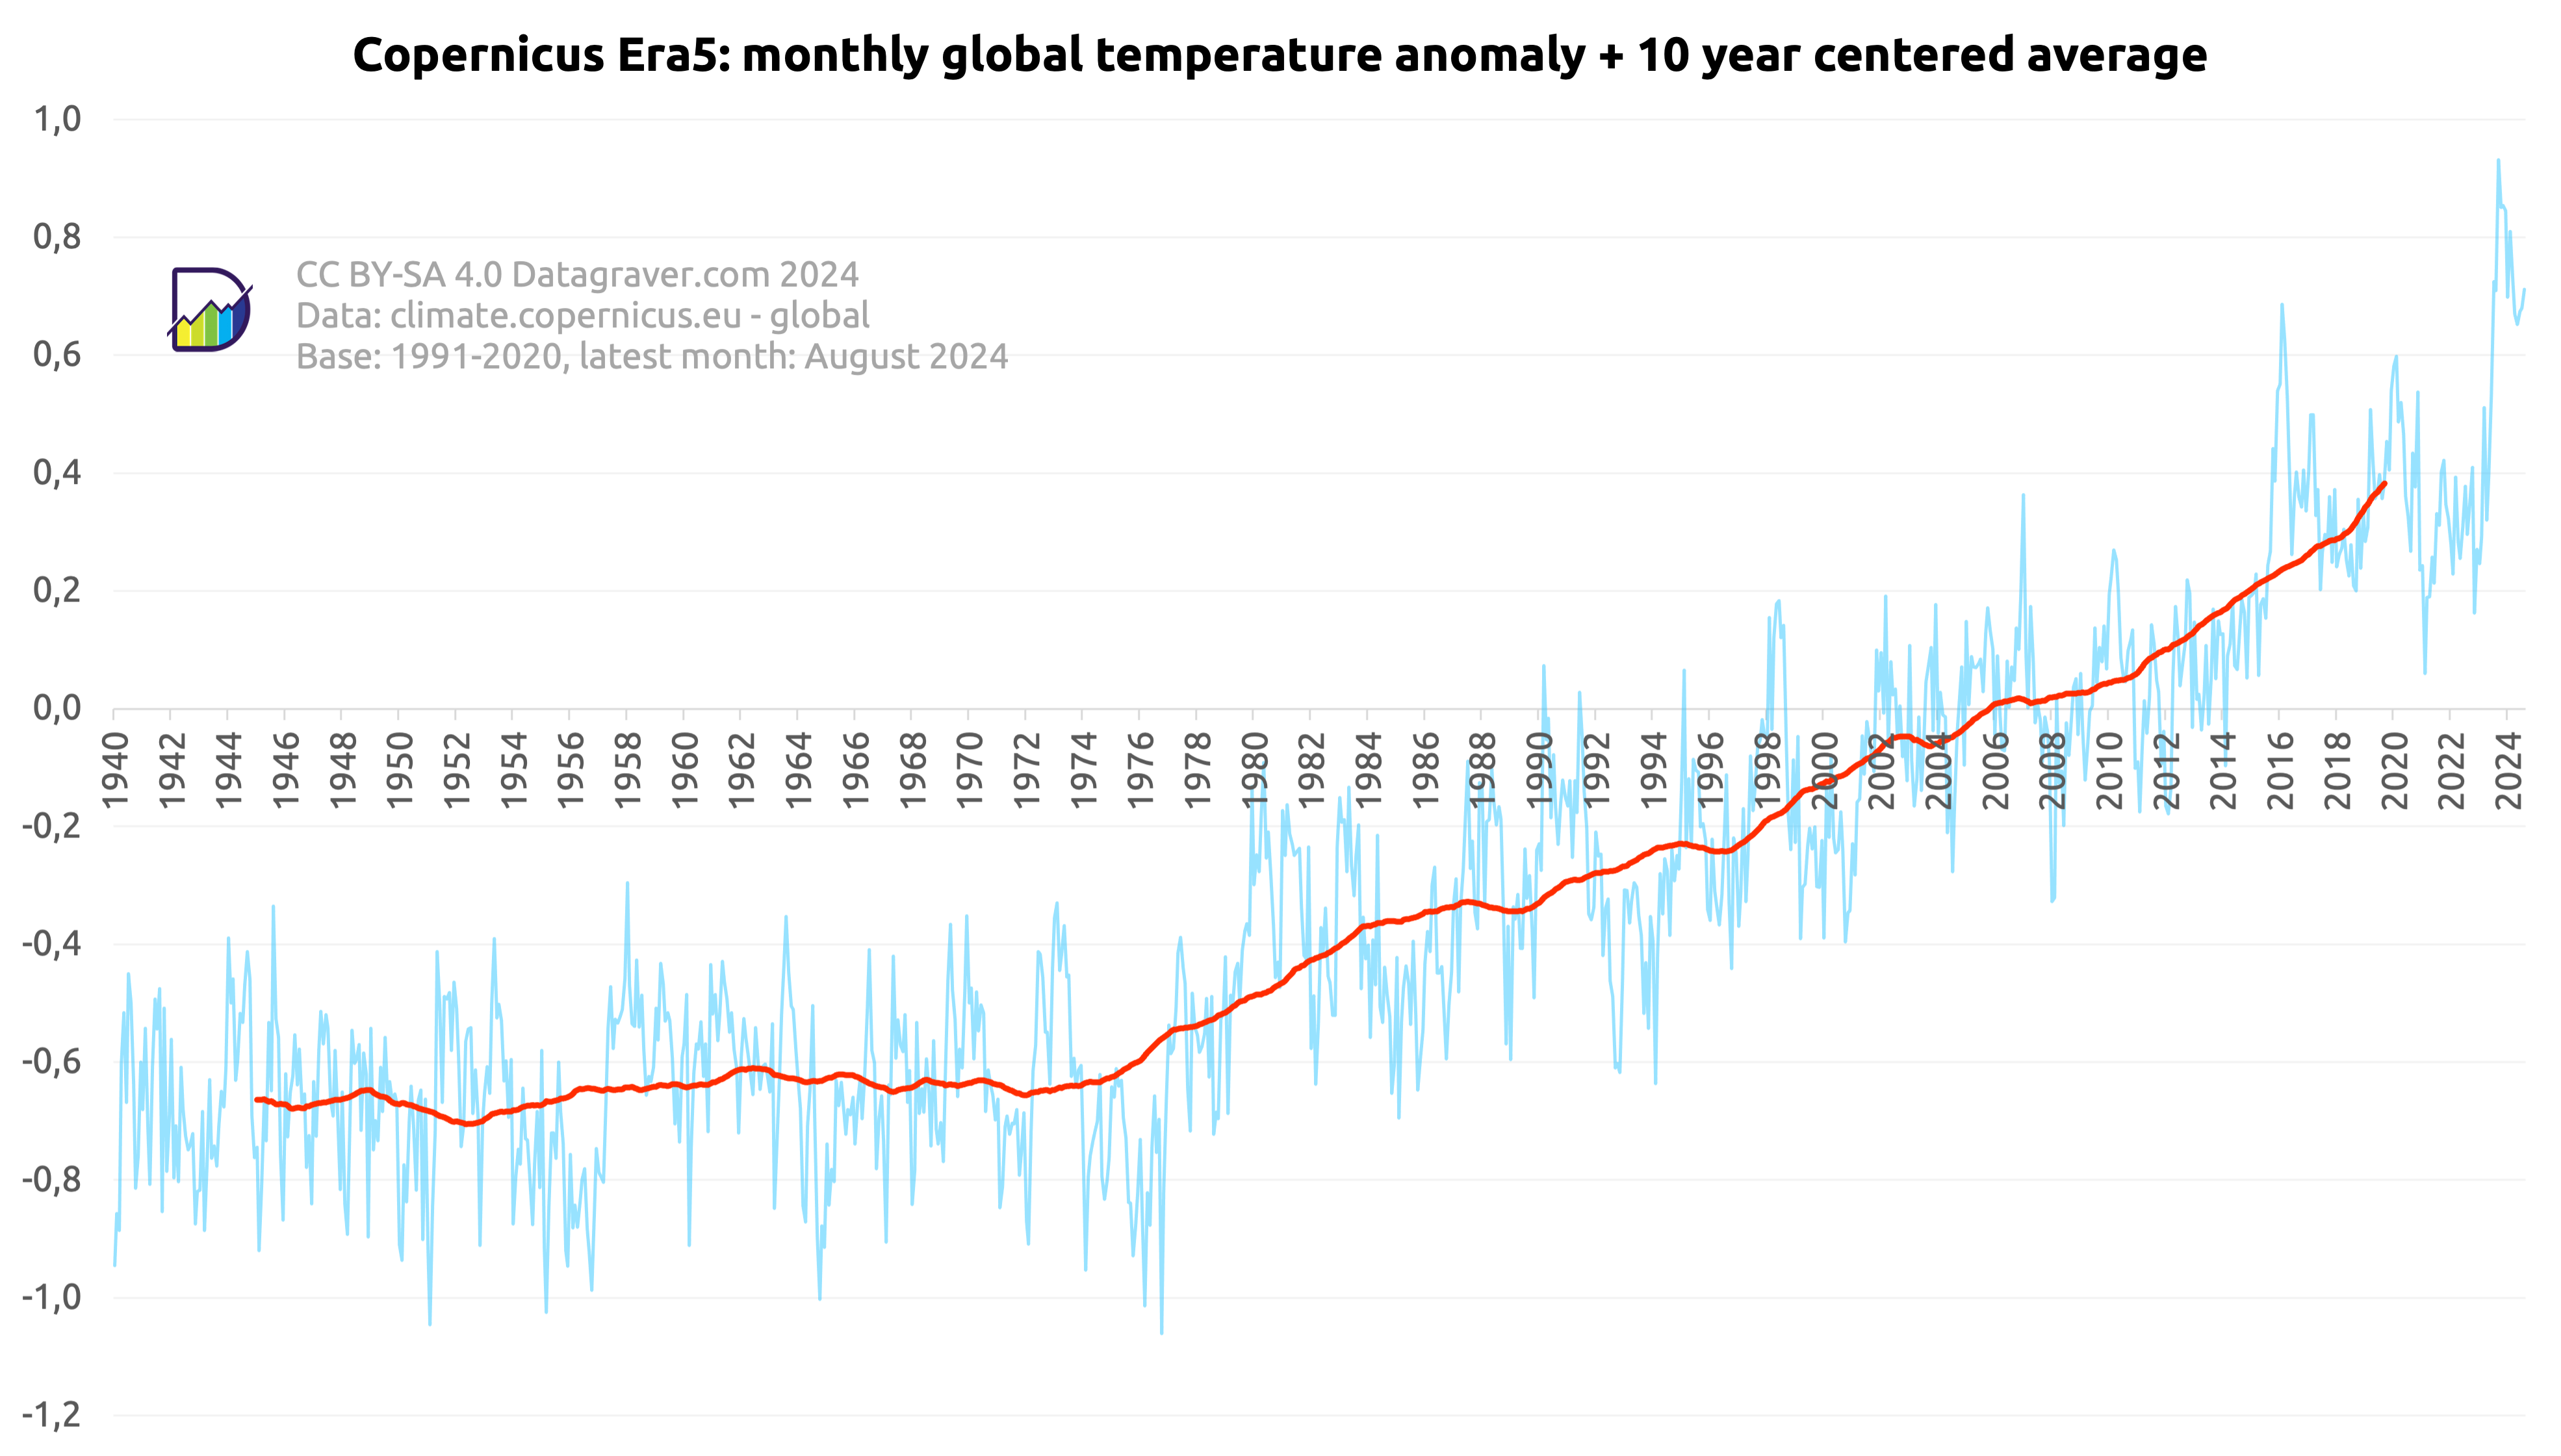
Here graphs based on the climate data set created by Copernicus Programme as implemented by ECMWF, supplemented with the data from 1940 to 1978.
Regular updates. Check date in graph.
First graph is on the monthly anomalies plus a 10 year centered average.
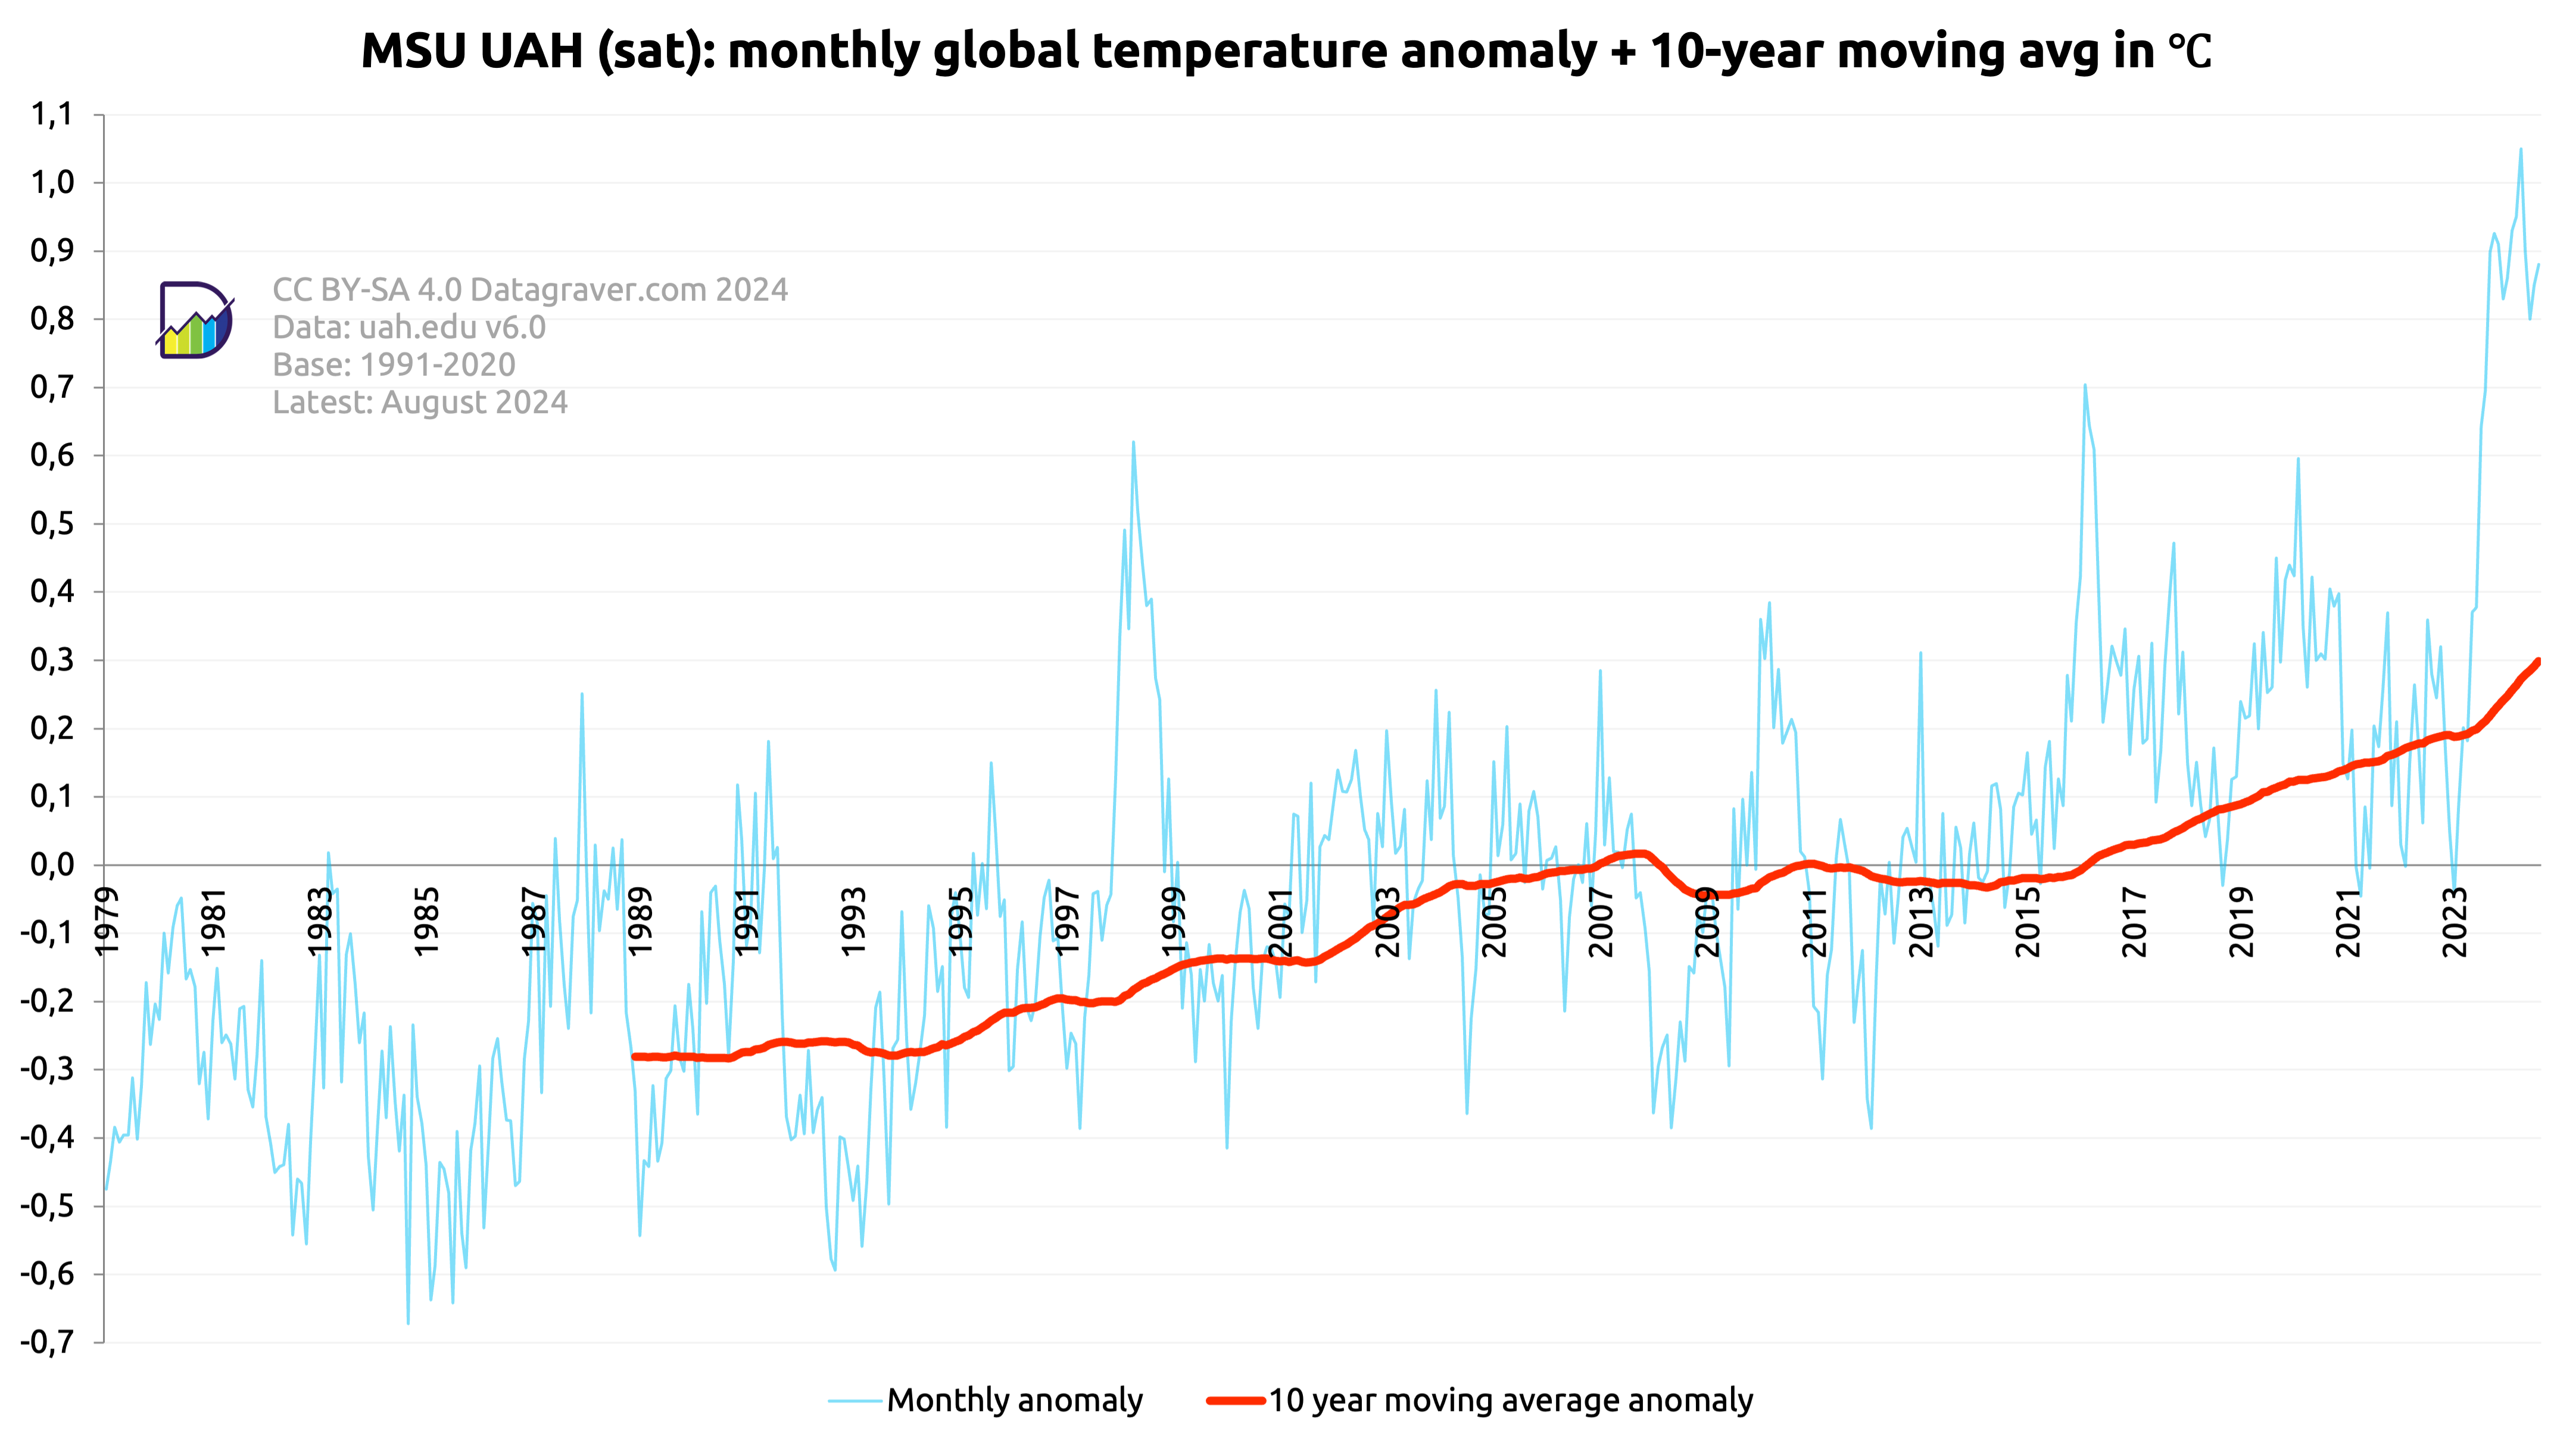
Here graphs based on the MSU UAH dataset (satellite) created by John Christy/Roy Spencer.
Regular updates. Check date in graph.
First graph is on the monthly anomalies plus a moving 10 year average.
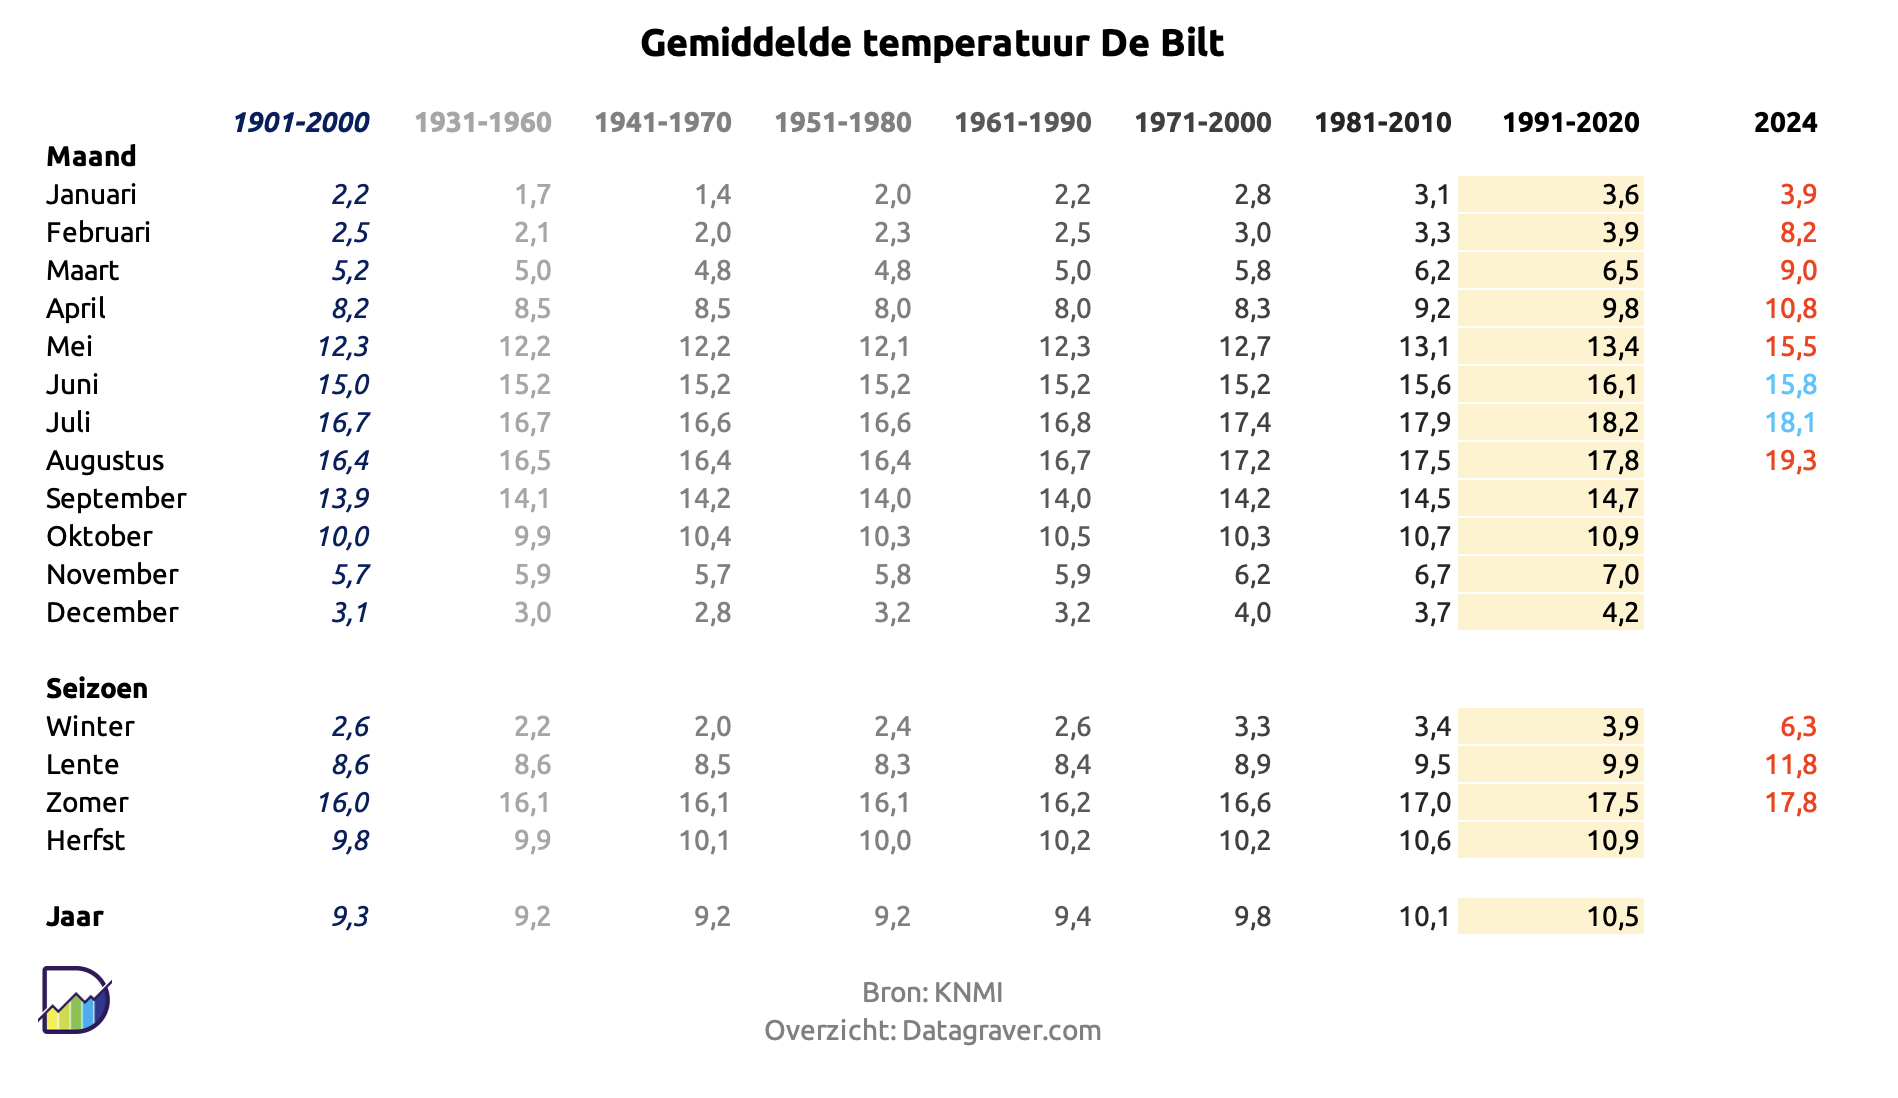
Voor de Bilt wordt per maand, per seizoen en per jaar een gemiddelde temperatuur gegeven. Vaak wordt dit vergeleken met een referentie periode (het “normaal”). In onderstaand overzicht vergelijken we de gemiddelden met de huidige en eerdere normalen.