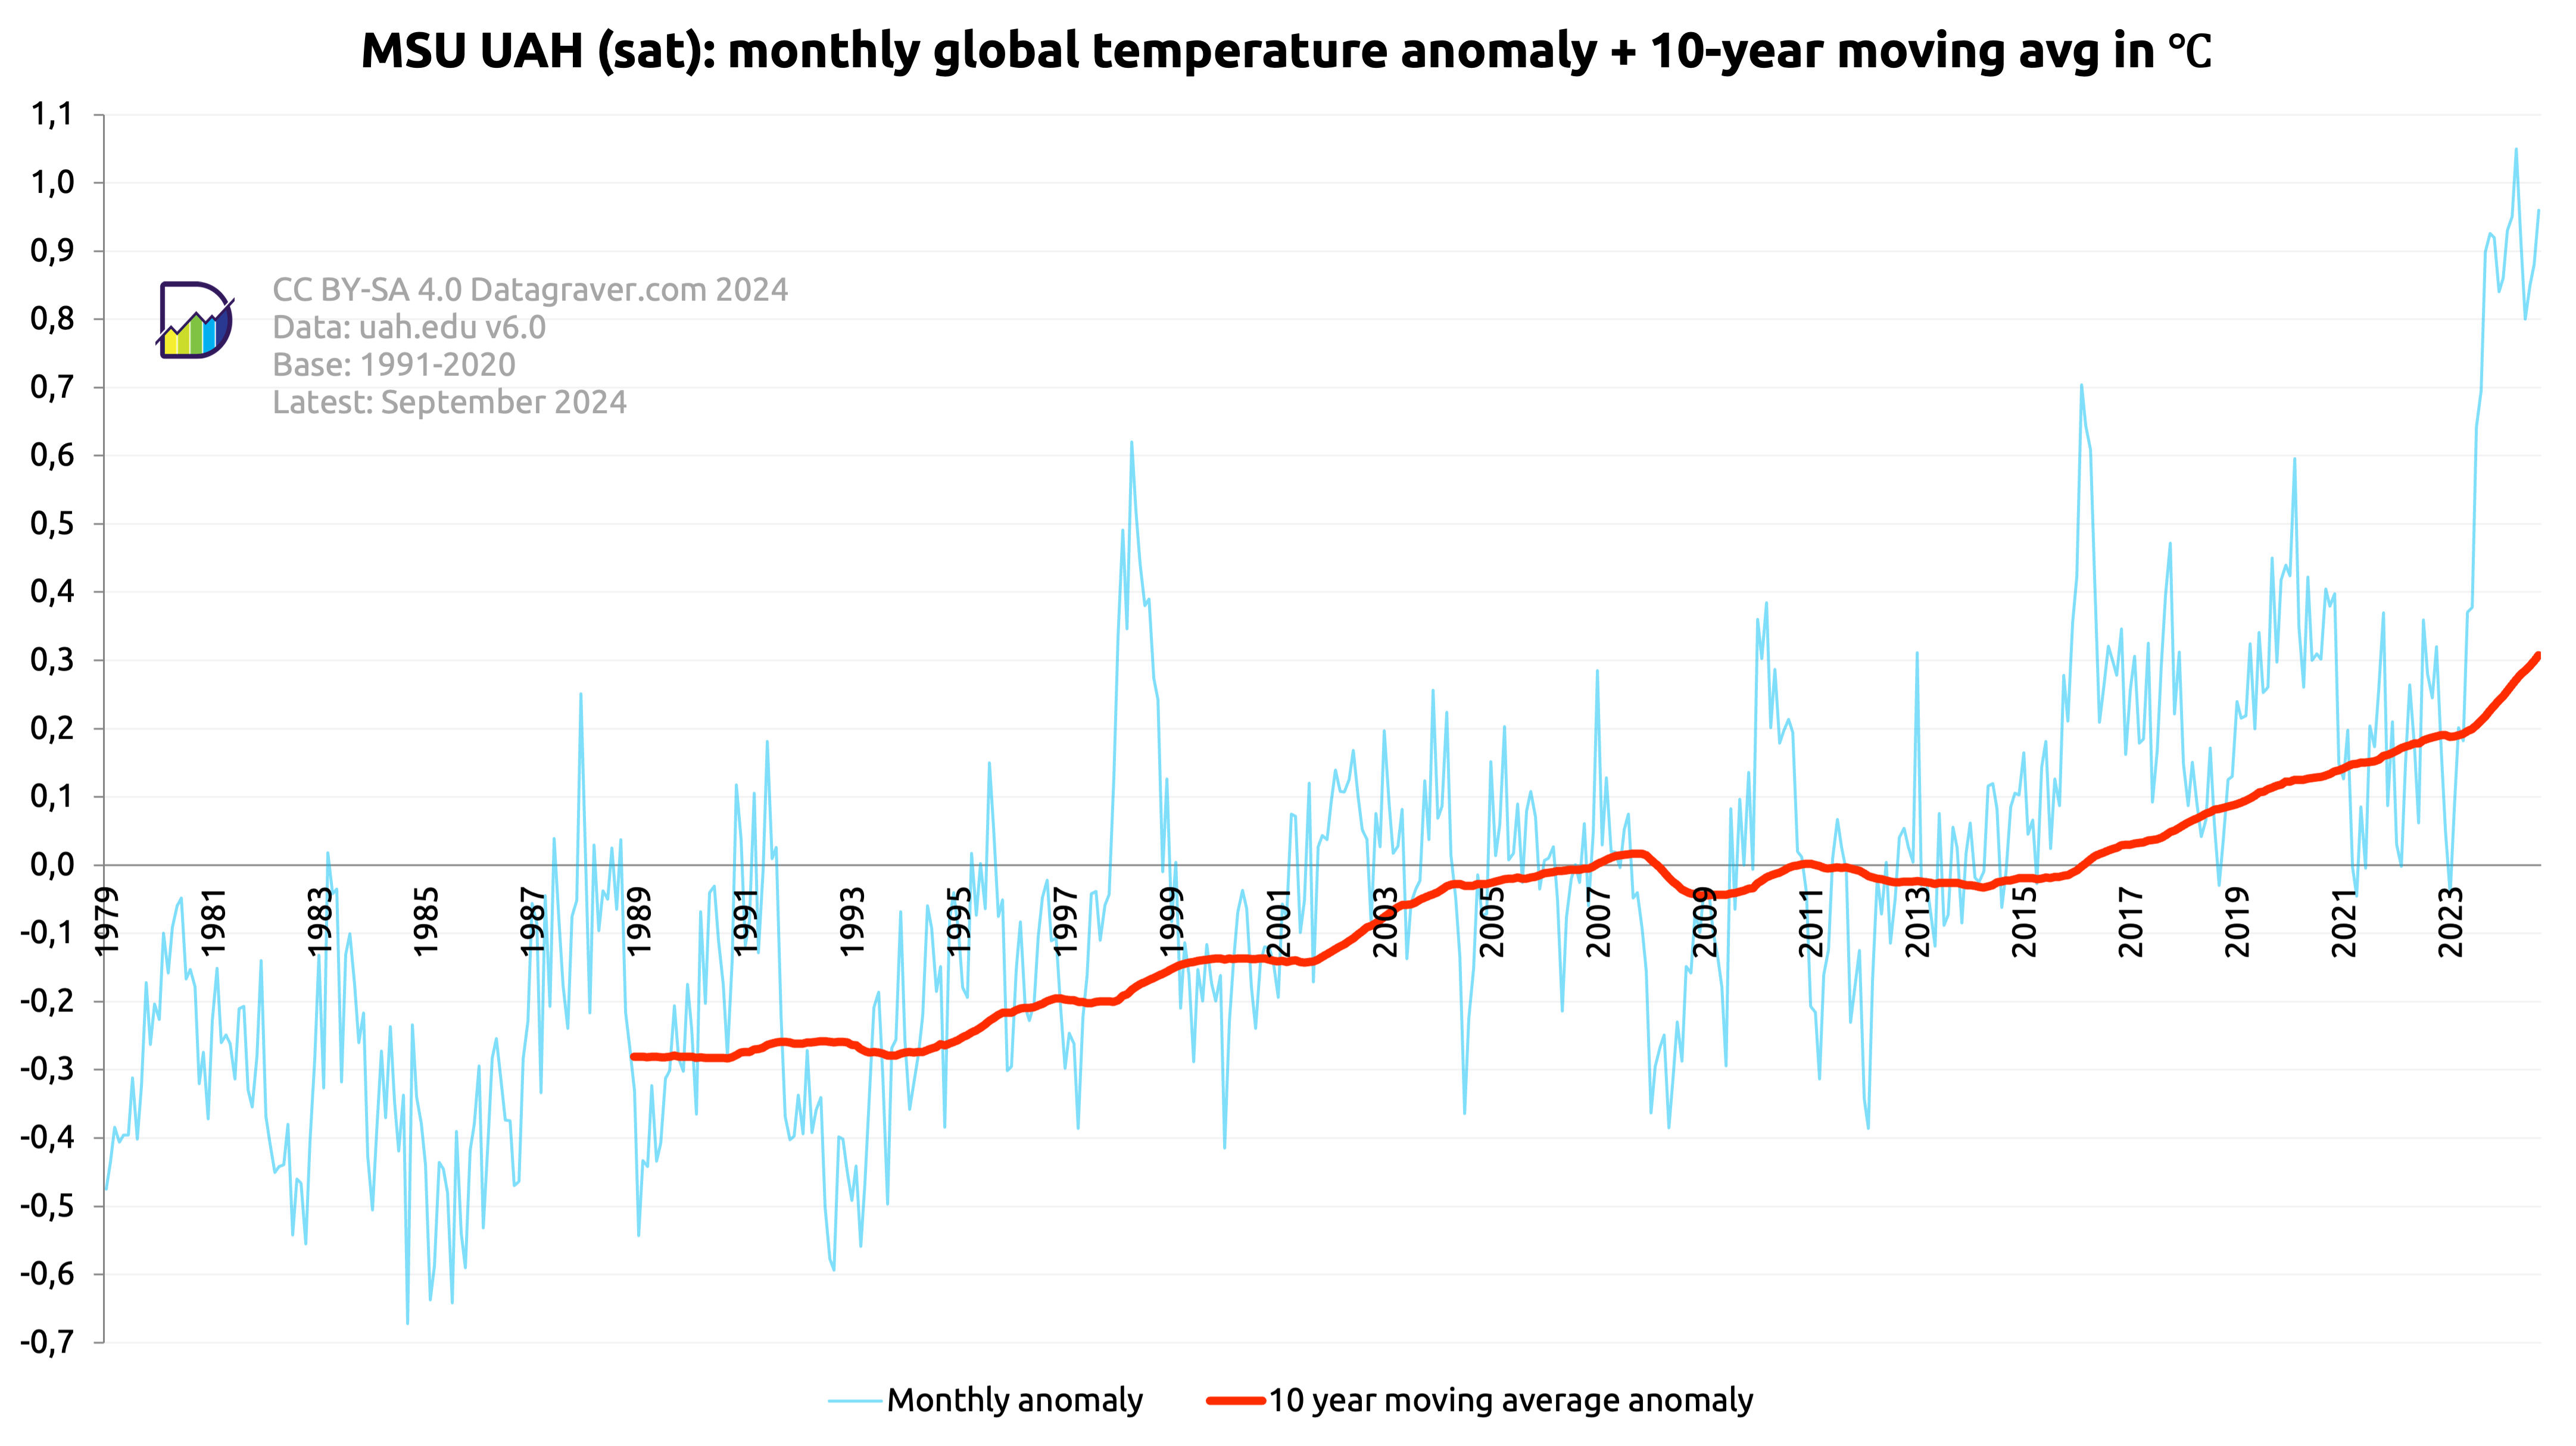
Here graphs based on the MSU UAH dataset (satellite) created by John Christy/Roy Spencer.
Regular updates. Check date in graph.
First graph is on the monthly anomalies plus a moving 10 year average.
Digging data
Here graphs based on the MSU UAH dataset (satellite) created by John Christy/Roy Spencer.
Regular updates. Check date in graph.
First graph is on the monthly anomalies plus a moving 10 year average.
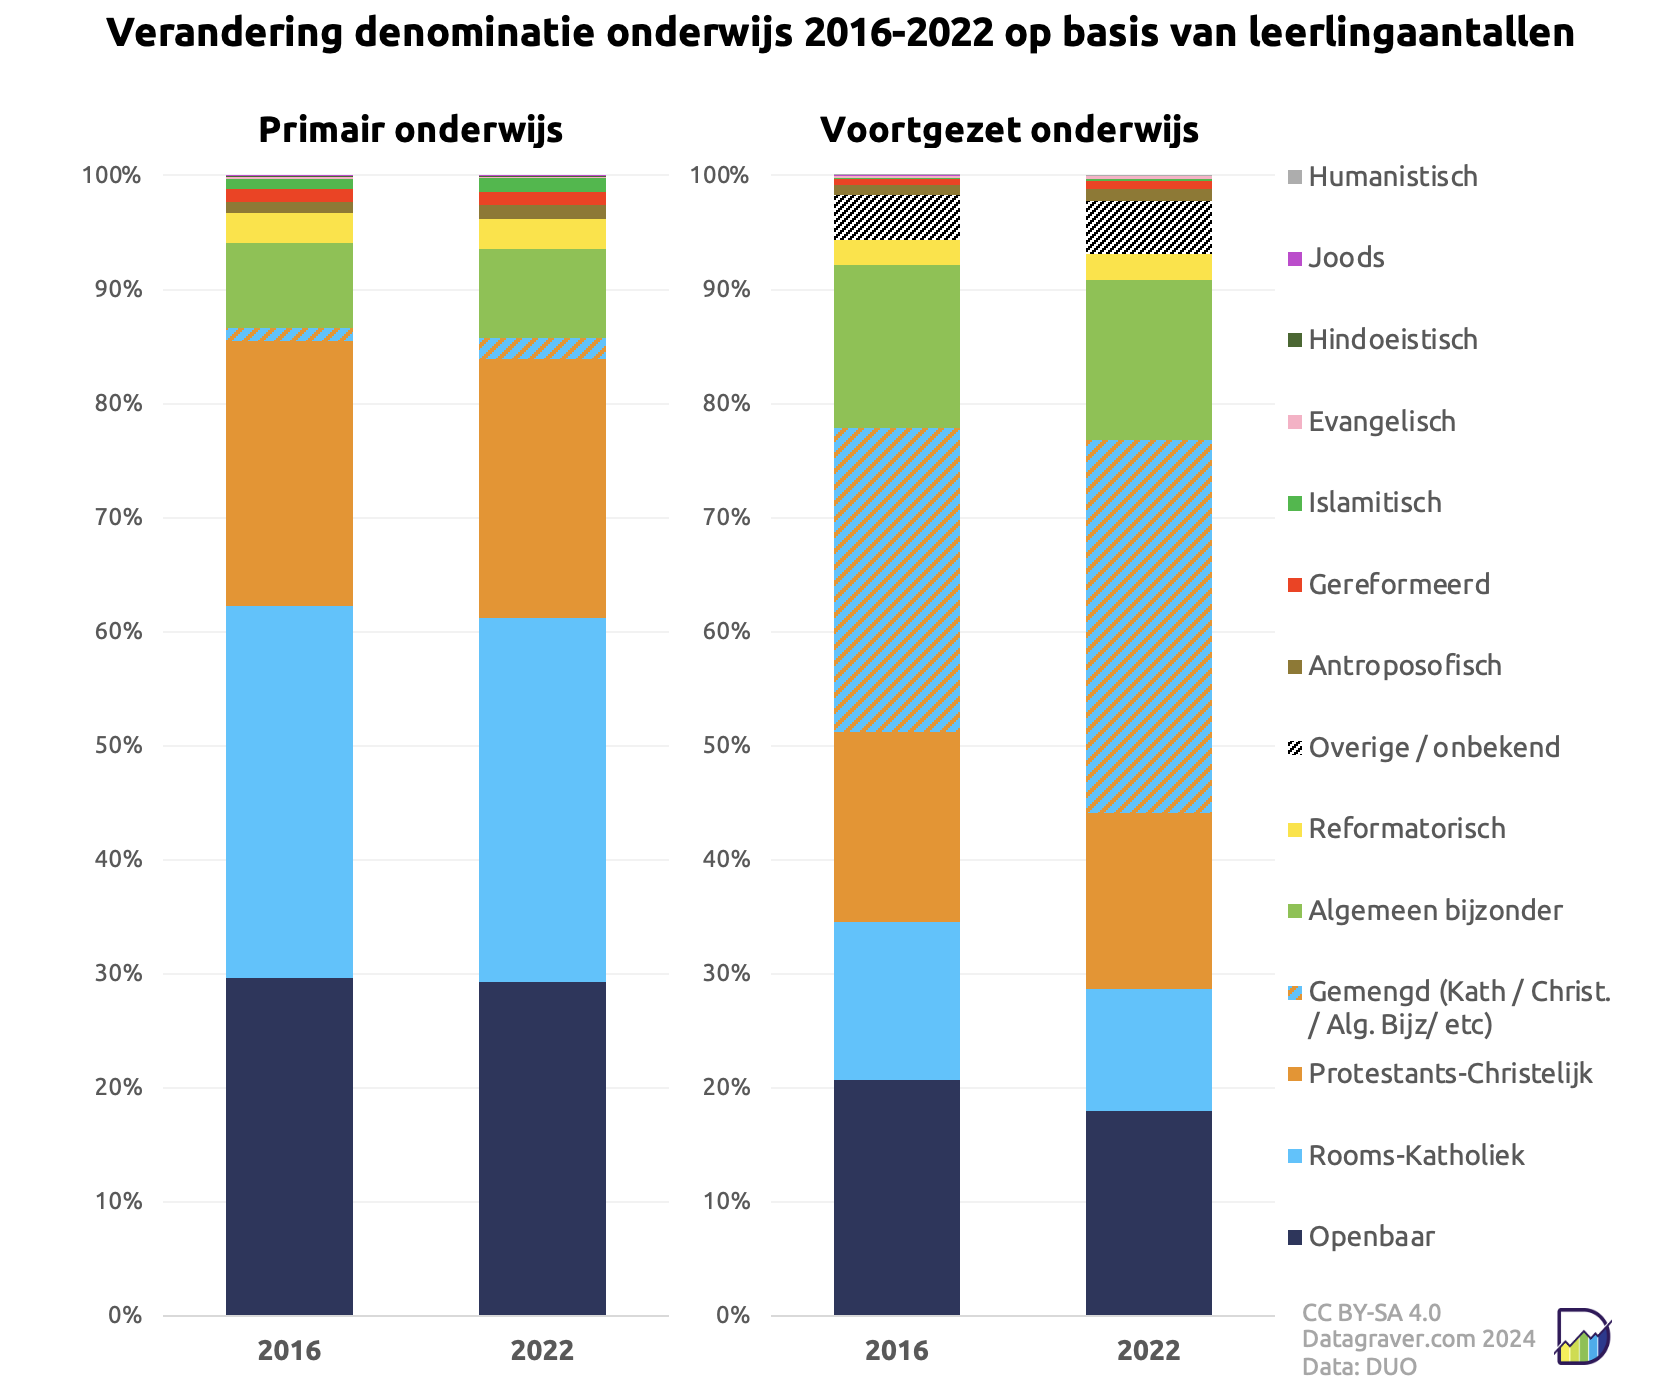
Verdeling denominatie scholen, primair en voortgezet onderwijs, op basis van leerlingaantallen, jaren 2016 en 2022 vergeleken.
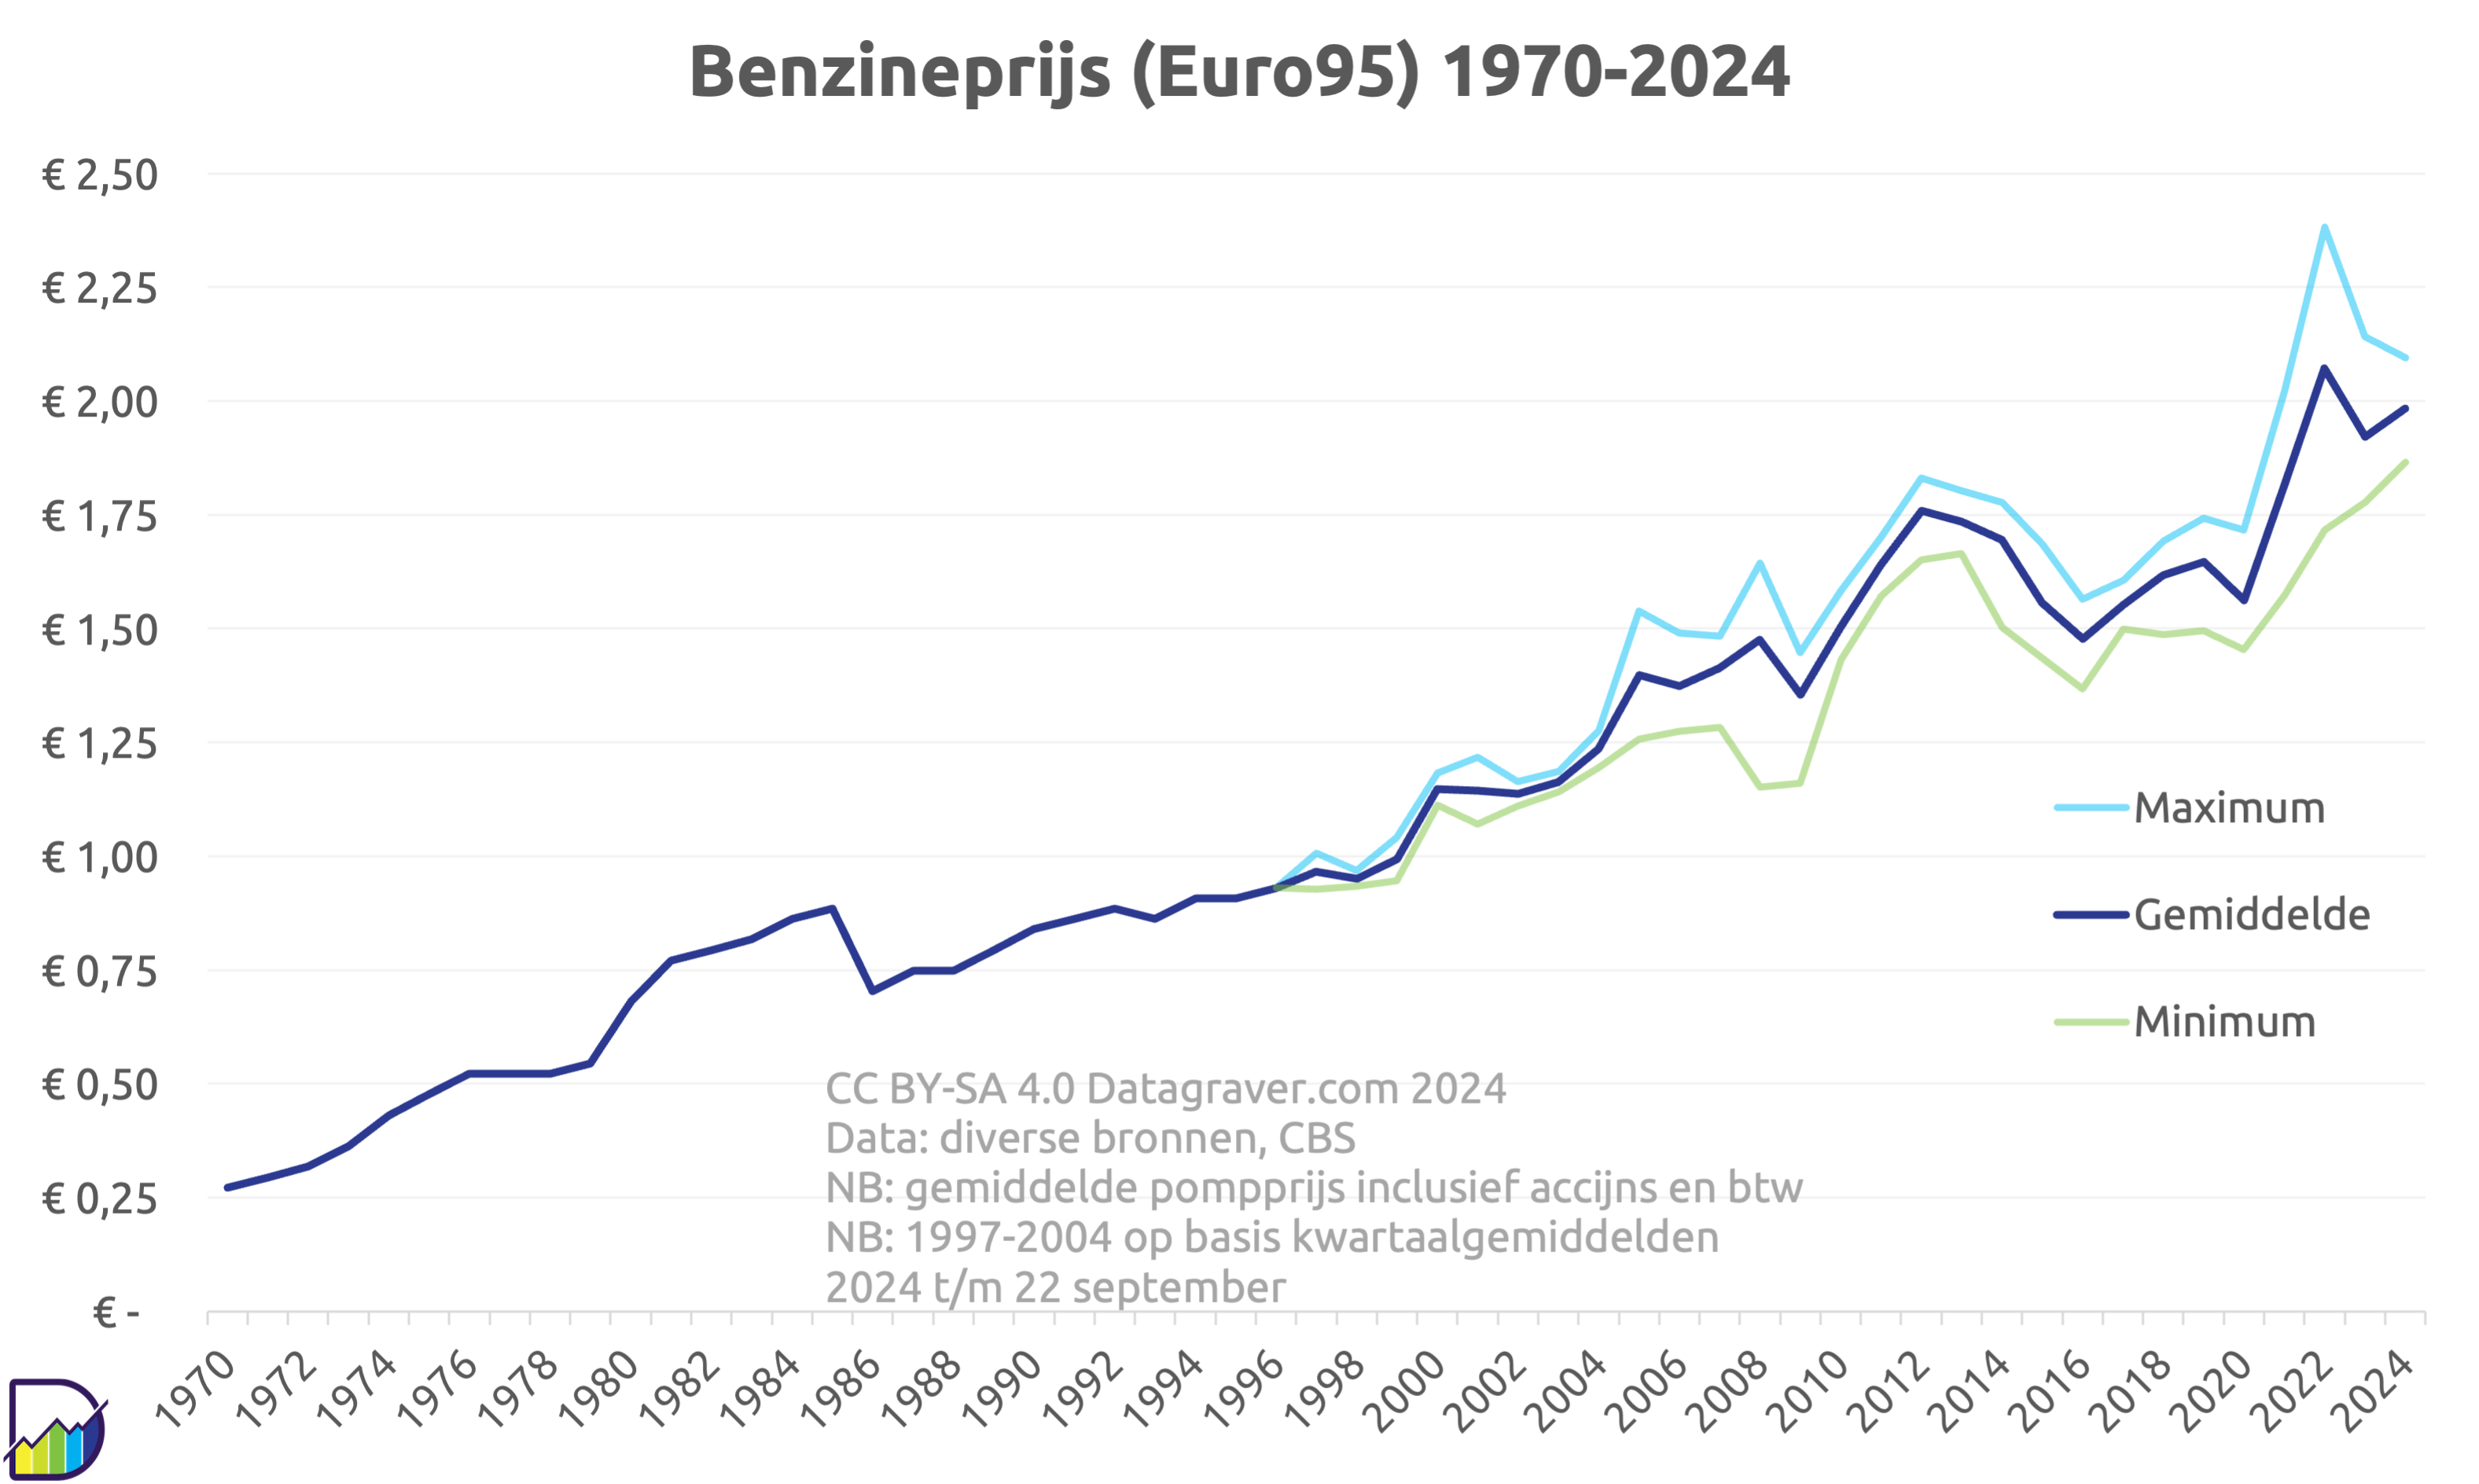
Ontwikkeling prijs liter benzine (Euro95) vanaf 1970.
Voor de periode tot 1996 alleen een gemiddelde prijs over een heel jaar gemeten beschikbaar. Vanaf dat jaar een gemiddelde, minimum (laagste prijs in het jaar) en maximum (hoogste prijs in dat jaar).
Cijfers voor het laatste jaar zijn nog in ontwikkeling.
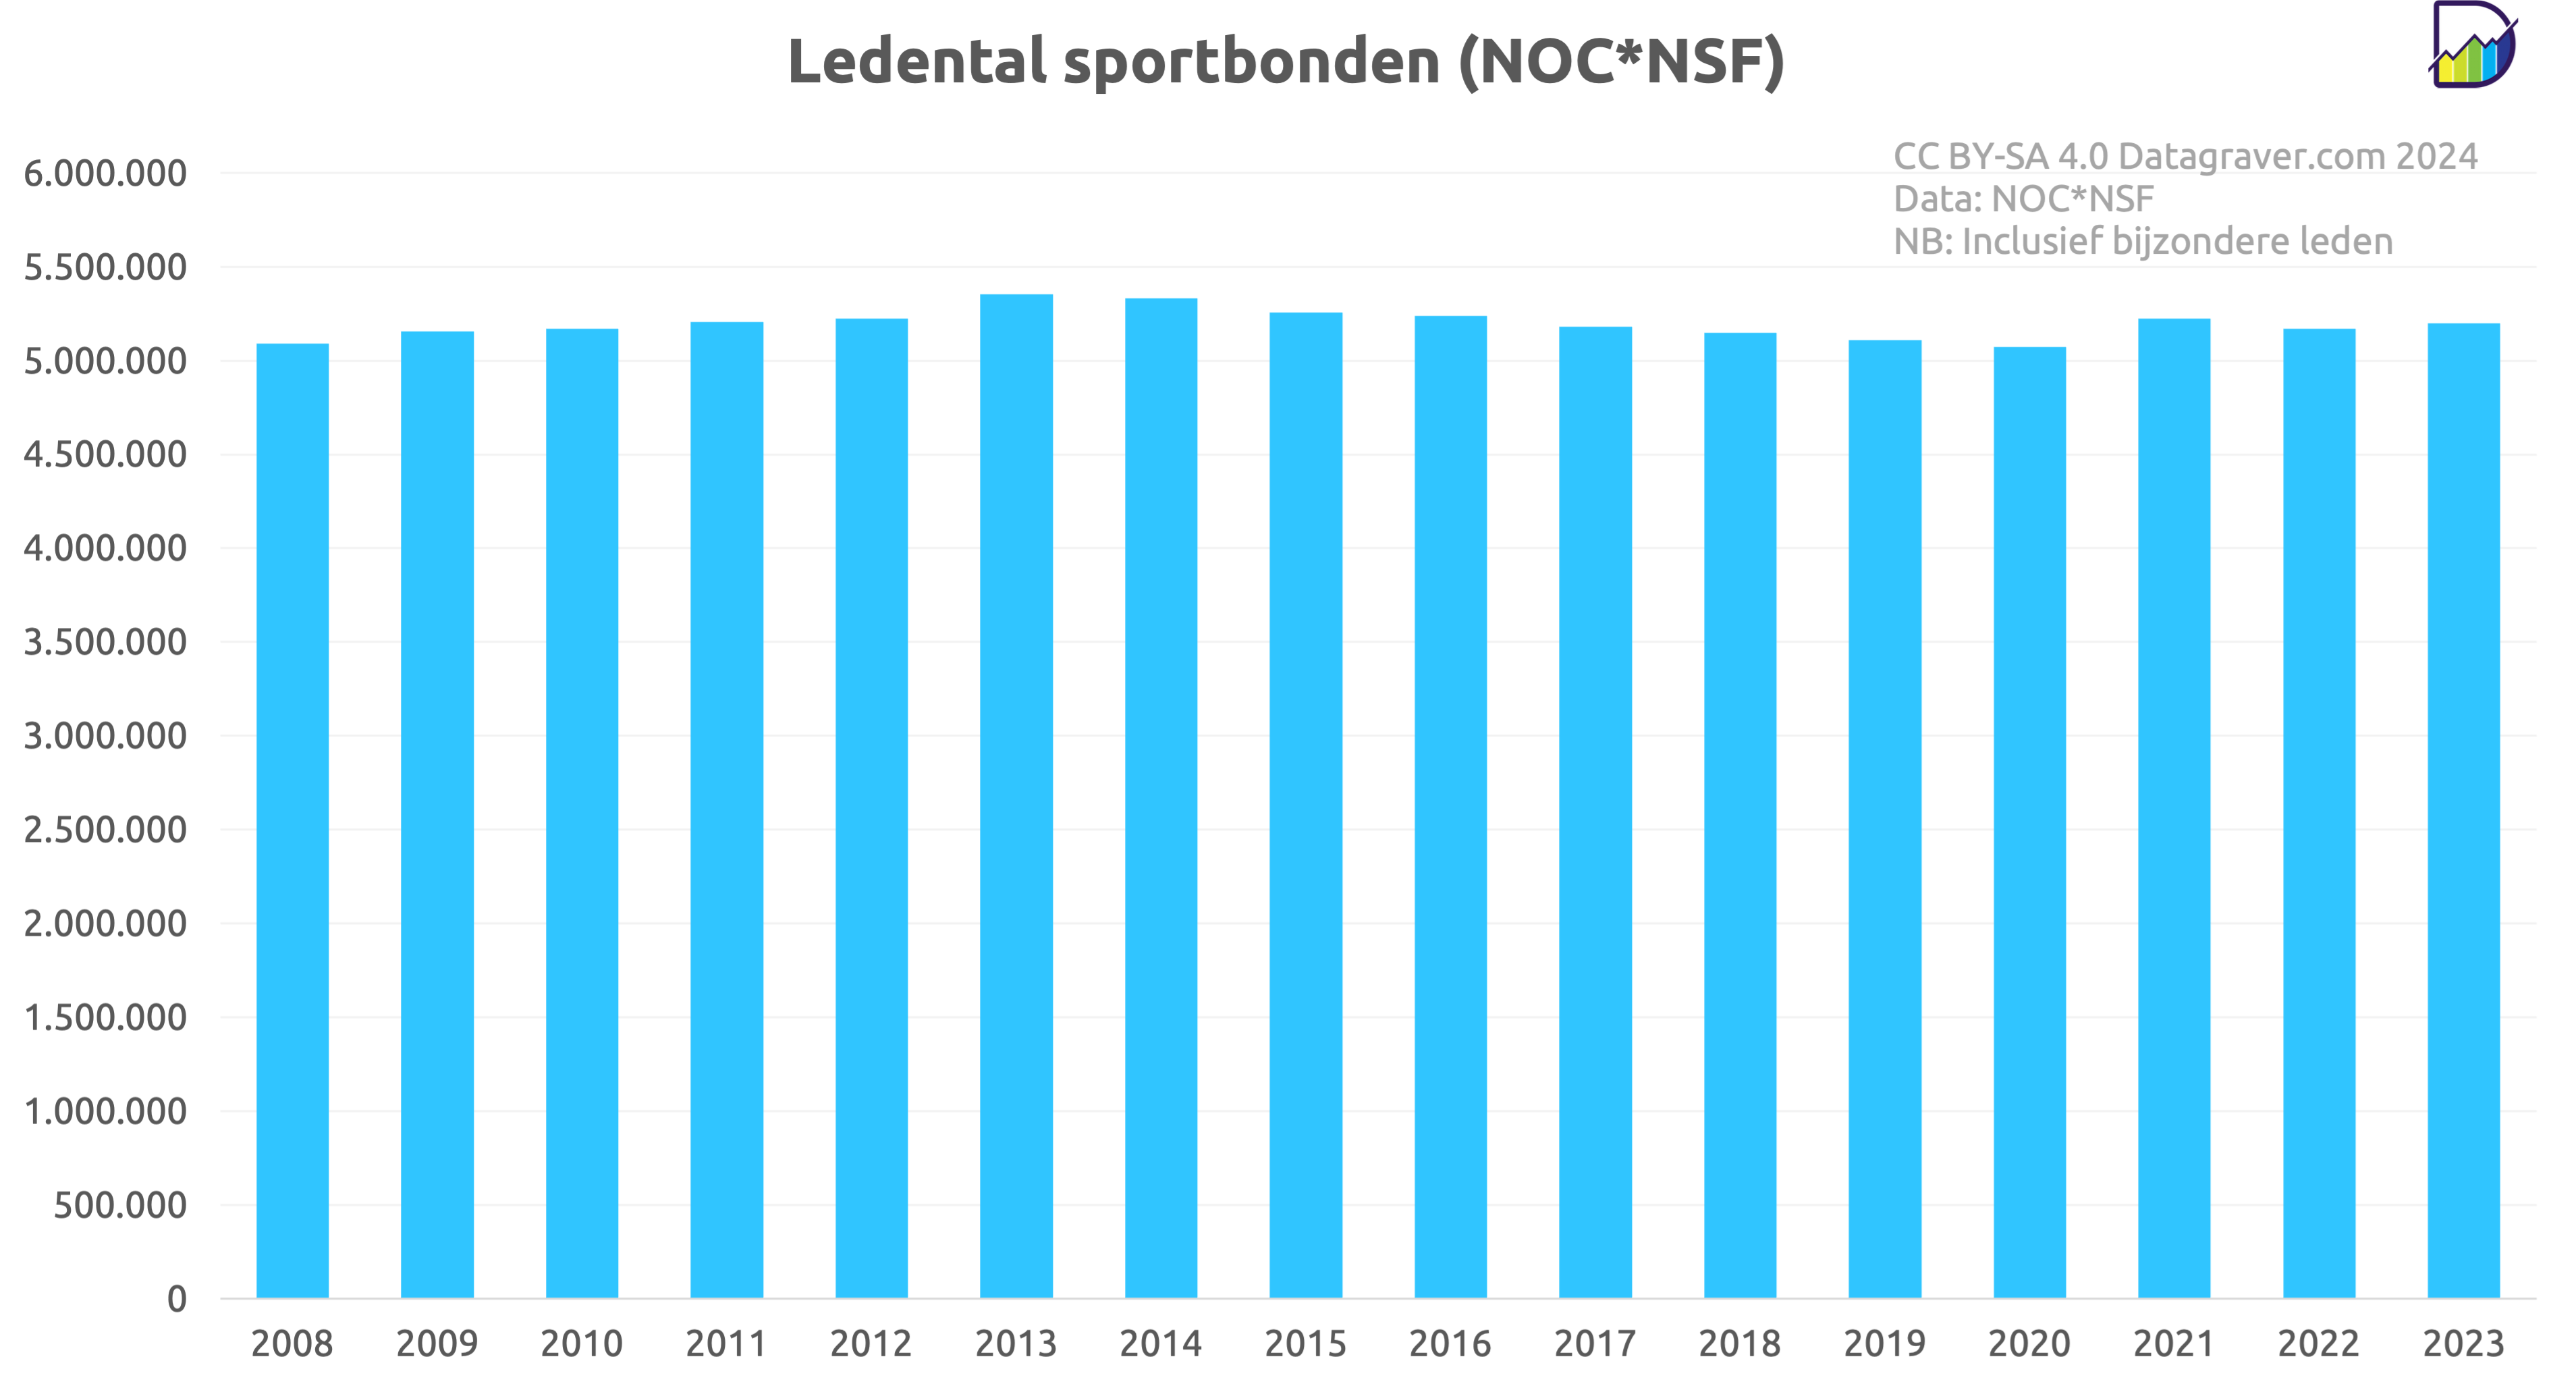
Op basis van de jaarlijkse rapportage van NOC*NSF over alle aangesloten sportbonden hier diverse grafieken.
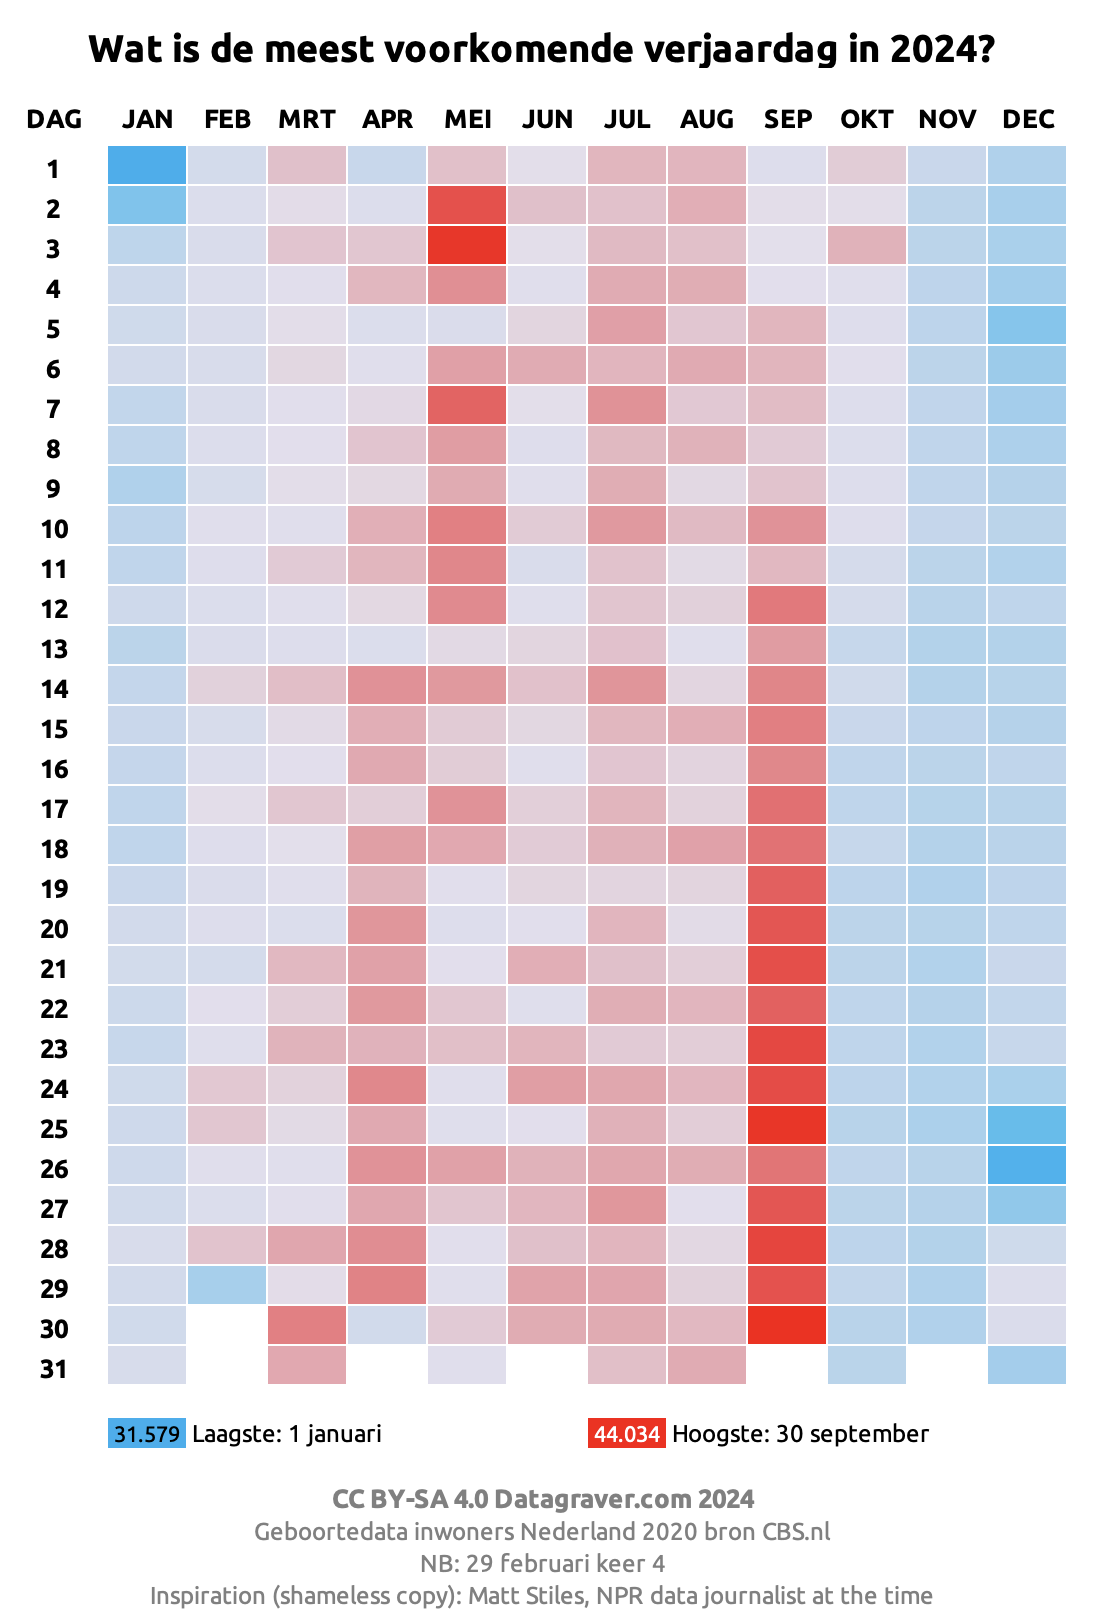
Op welke dag in het jaar zijn de meeste en minste mensen jaar in 2024. Aan de hand van tabel CBS.
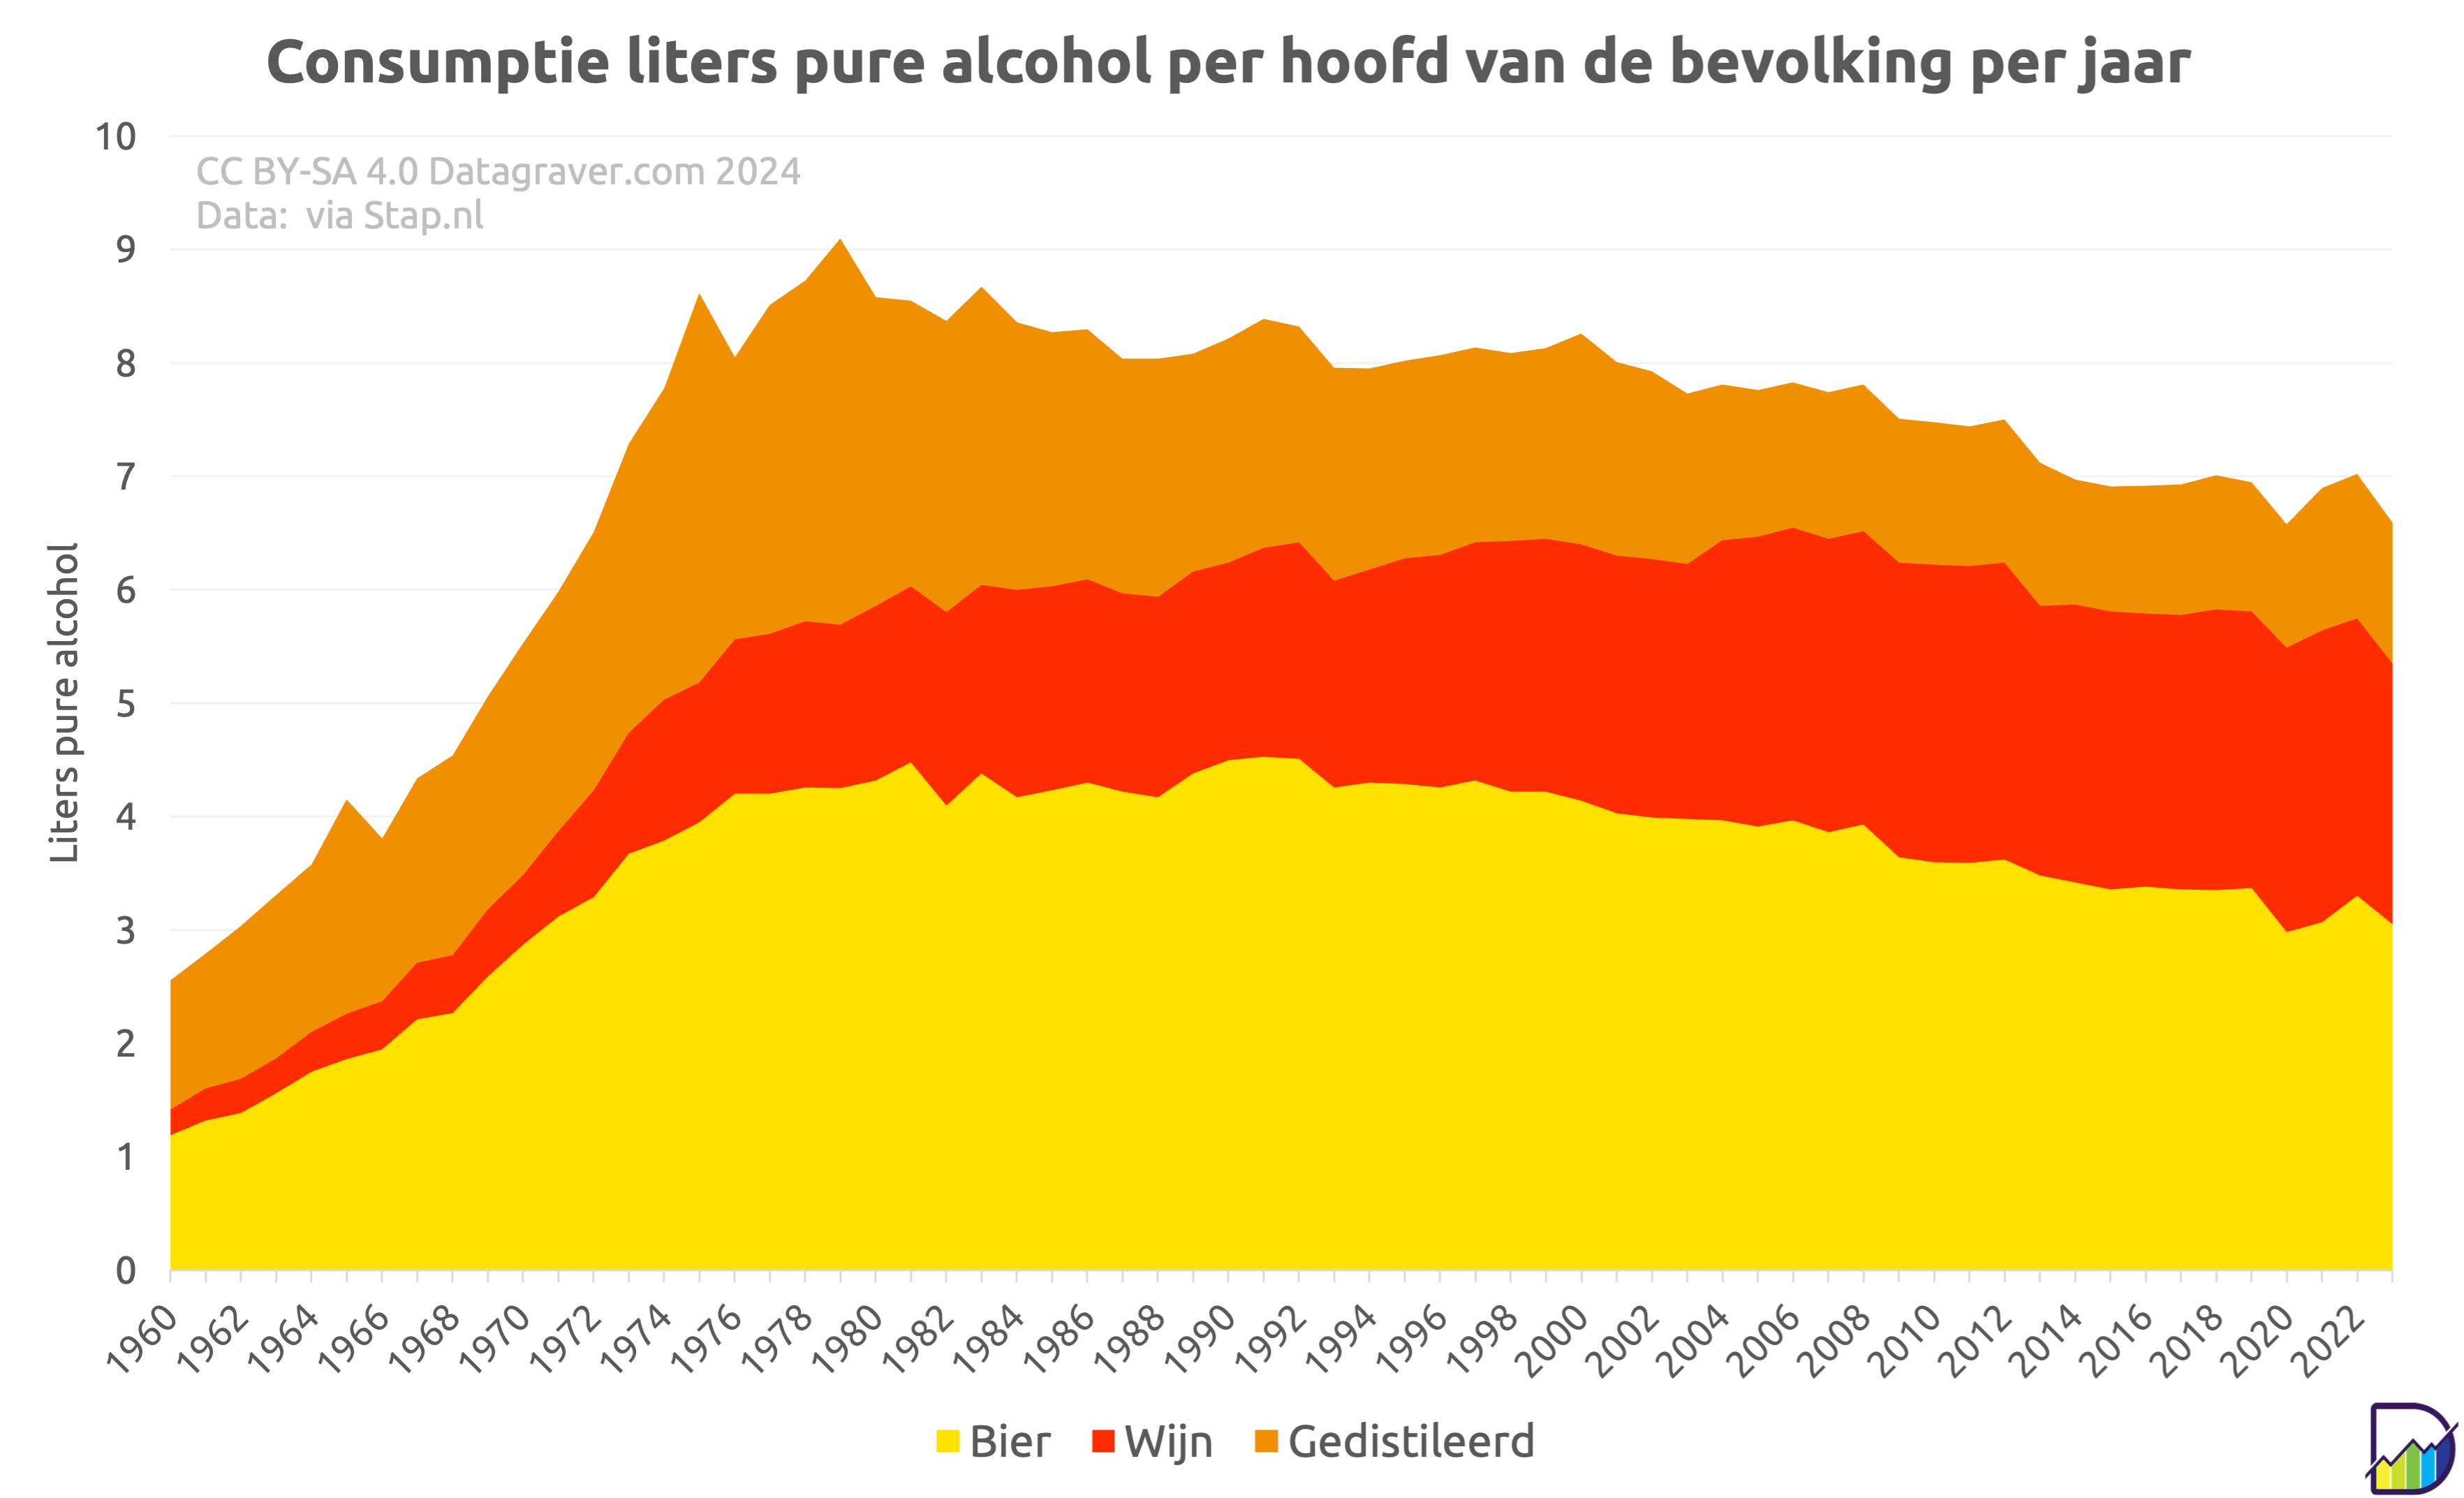
Consumptie alcohol in Nederland uitgedrukt in liters pure alcohol per hoofd van de bevolking per jaar.
Cijfers en meer informatie over alcoholbeleid bij Stap.
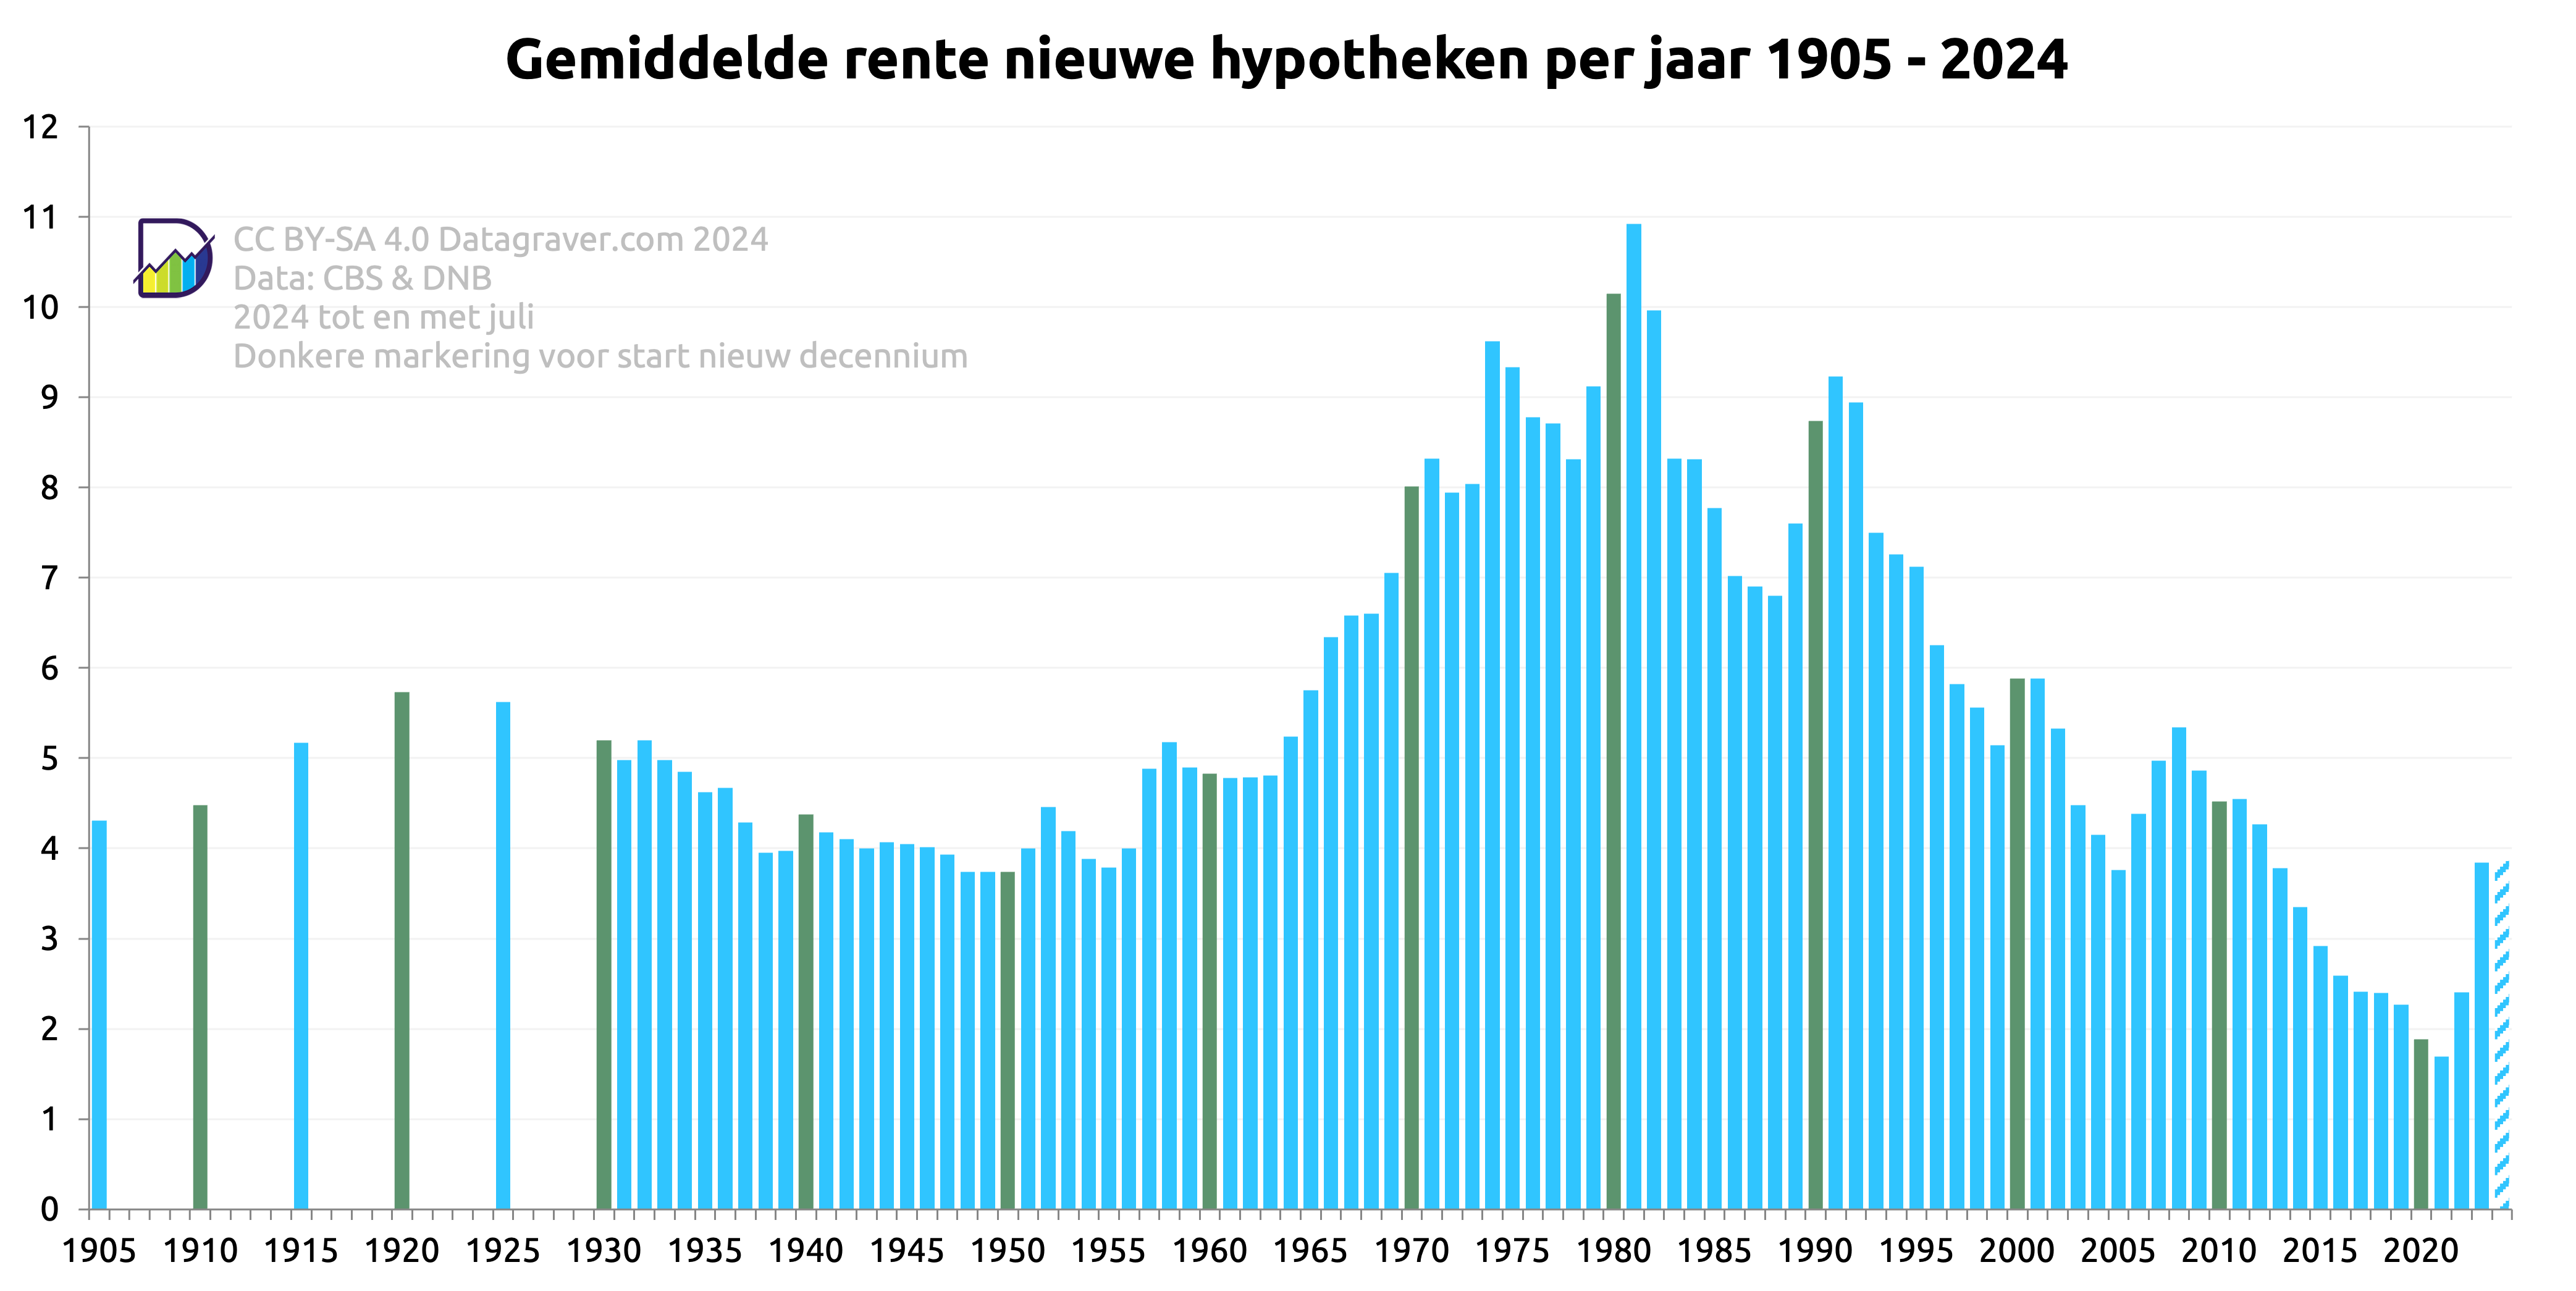
Per jaar is bepaald wat de gemiddelde rente in dat jaar was bij het afsluiten van nieuwe hypotheken in de consumentenmarkt. Actuele data komt van DNB, historische data uit de CBS archieven.
Het lopende jaar (licht gekleurd) is de gemiddelde rente over de maanden tot 1 maand voor datum van deze post.
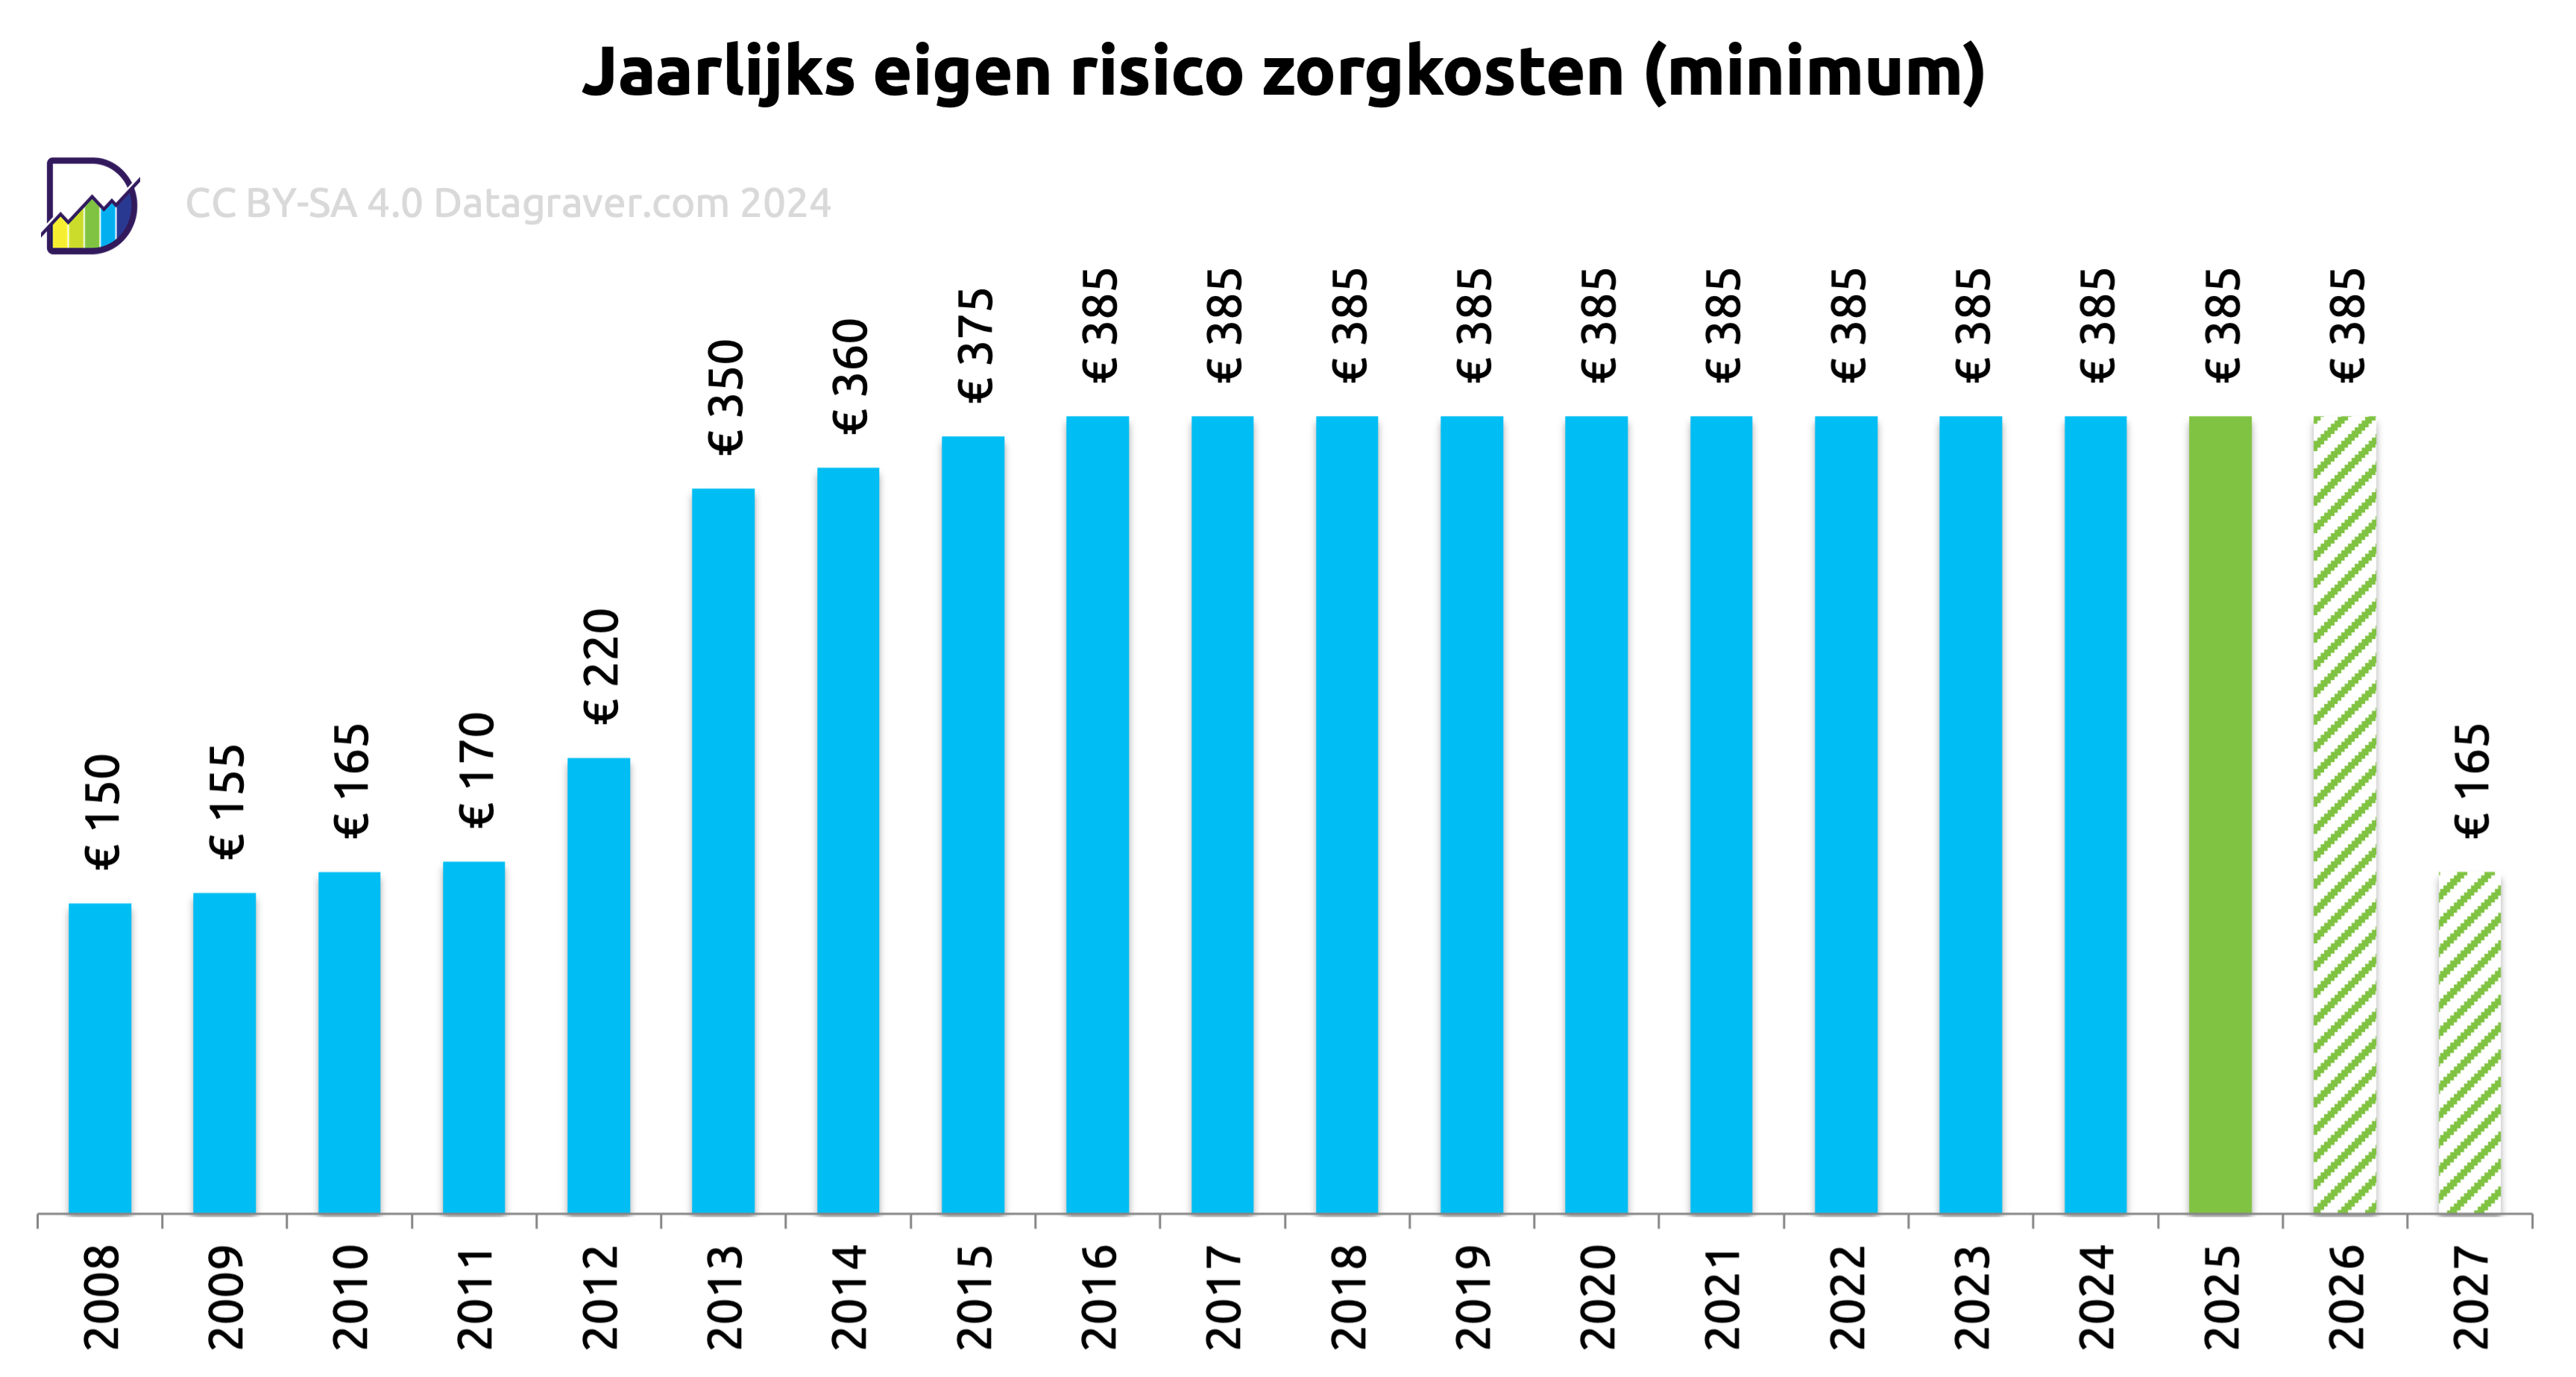
Ontwikkeling van het eigen risico per persoon voor zorgkosten, plus verwachting.
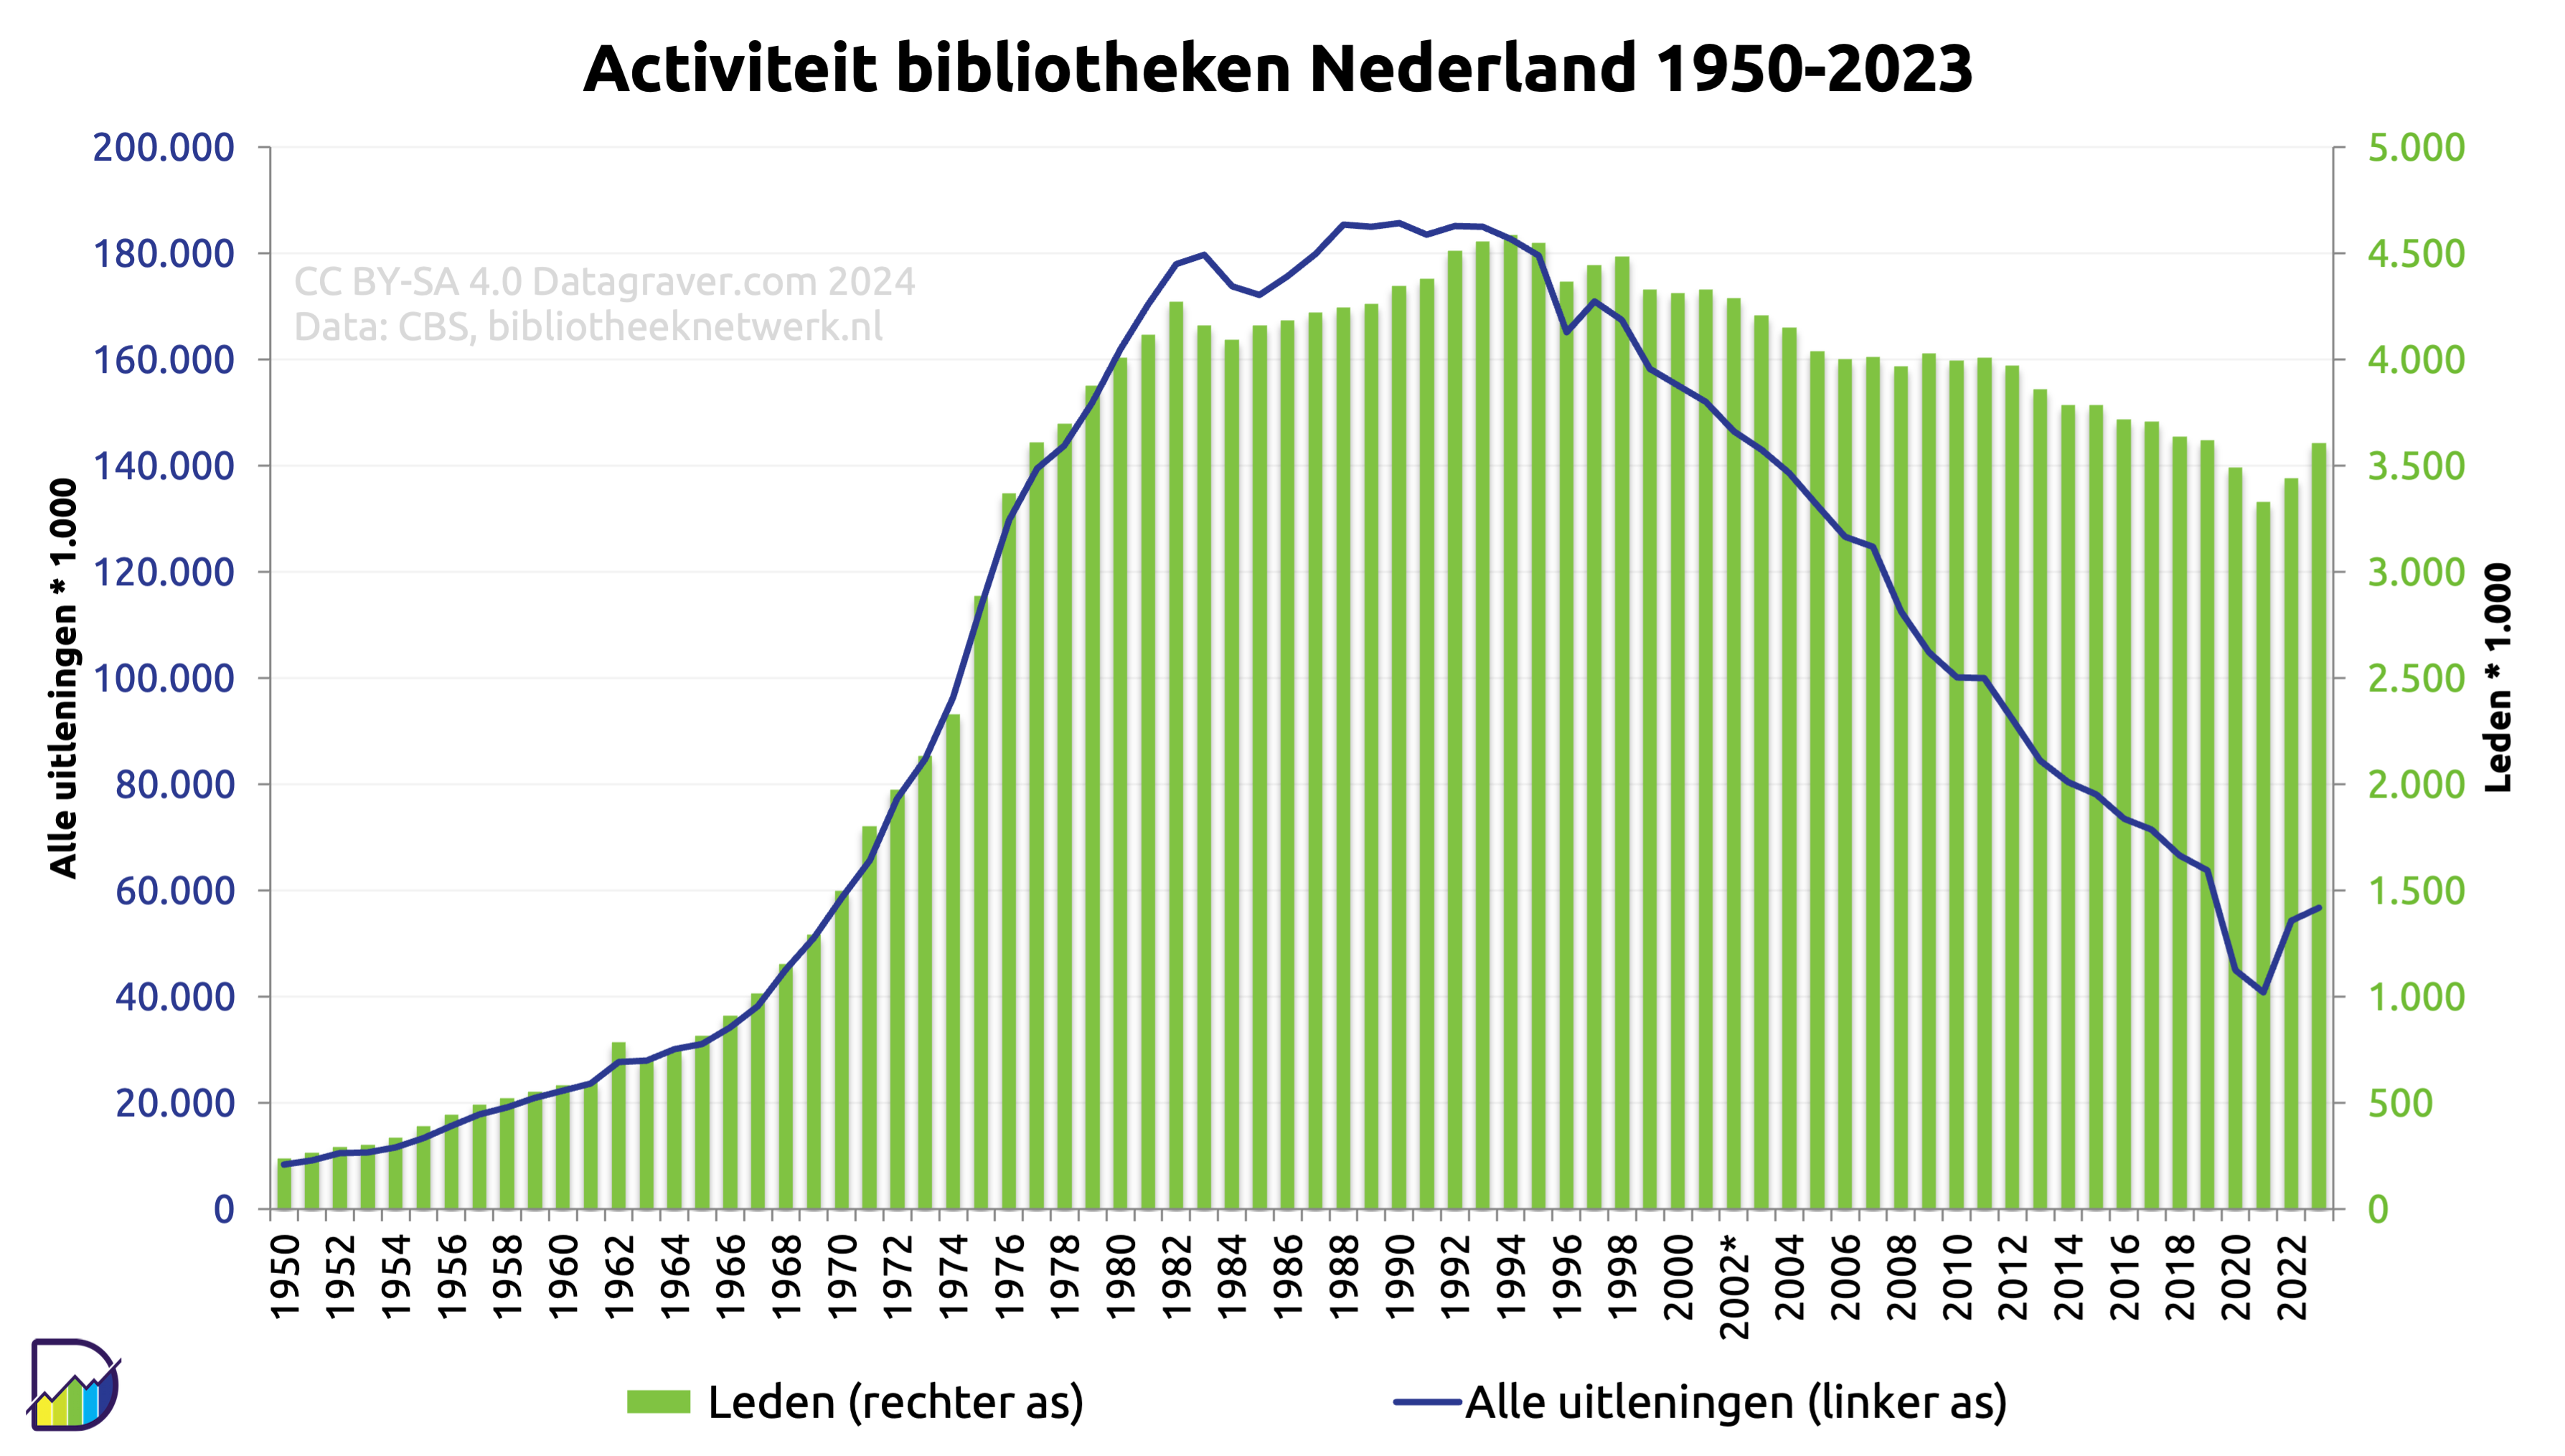
Diverse grafieken over aantal bibliotheken, ledental en uitleningen fysieke en digitale boeken. Recente data via Bibliotheeknetwerk.nl.
Eerst een grafiek met de activiteit van de bibliotheken.